Showing posts with label cranio-facial patterns. Show all posts

Saturday, December 27, 2014

Historical Greek racial continuity and Modern-Ancient Greek physical similarity is a reality.

Above : Modern Greek actresses reenact ancient Greek Olympic ceremonies.


It is occasionally stated that today's Greek speaking population of Greece and the Aegean & Ionian seas bare little physical resemblance, and have little to no ancestral connection to the Greeks of old.  The doubters usually say so out of ignorance or an obvious racial bias of their own. However, regardless of anyone's opinion, the notion is completely falsified by hard scientific inquiry. There exists much data and summaries in the (physical) anthropological literature refuting those type of dubious claims.


 J Lawrence Angel's conclusion


The most comprehensive skeletal analysis of ancient Greek material was done by the late J. Lawrence Angel. Angel took a schematic approach though his examination of Greek skeletal remains by way of his own conceived morphological/typological system. By this method he came to the conclusion that modern Greeks show significant physical continuity and physical similarity to the ancient Greeks.  


Angel 1944 (page 337) notes
"So great is the phenotypic racial continuity of the Greek people in ancient times (and probably down to the present day) that the average ancient Greek male defined by the total series in table 2 may well stand for ancient Greece as a whole as well as for the standard of comparison for the six types."
See averages here & here.


Angel came to the conclusion that the Mycenaean era ancient Greeks descended largely from an earlier Neolithic 'pre Greek' agricultural population around the Aegean, which then amalgamated with Bronze age migrations from the north [and also to a lessor extent from the east]. Once this synthesis was complete, the basic foundation of the Greek ethnicity was formed. This Mycenaean foundation is STILL the fundamental genetic foundation of the living Greeks. 

Angel 1944 (page 361) notes
"The Mycenaean blend seems to be fundamental in all later Greek populations down to the present day. Its formation was principally absorption of Middle Bronze Age intrusive strains by the pre-Greek racial substratum."


Angel 1944 (page 373) in his summary concludes.
1. "Ancient Greeks as a whole are unusually heterogeneous. 

2. Their high variability is 7% above normal, and expresses the contrast between six arbitrary morphological types : Basic White, an ill- filled, rugged, long-headed, coarse-faced version of Atlanto-Mediterranean ; gracile, dolichocrane, pentagonoid Classic Mediterranean, with narrowed triangular face ; muscular, well-filled, long, hawk-nosed, rectangular-faced Nordic-lranian ; mesocrane and high Dinaric-Mediterranean hybrid, with long nose in long hexagonal face; intermediate Mixed Alpine, with puffed-out mesocrane vault, big forehead, and squat face ; and round-headed, blunt-faced Alpine. These types are validated by close comparison with non-Greek groups, by their low variability, and by their generally successful predictions of period groups. 

3. Greek racial history shows an alternation of an overwhelmingly ‘ ‘Mediterranean” complex reflecting southeastern maritime infiltrations, and a more balanced Alpine-influenced combination of all types reflecting northern invasions. The former is typical of Mycenaean and Classical periods and occurs in the third millennium R.C. The latter dominates Middle Bronze, Early Iron, and Roman periods, with compromise effect in Byzantine. Within these fluctuations of opposing tendencies the major racial trend is in an Alpine direction, with minor Dinaric specialties. 

4. Racial continuity in Greece is striking. 

5. Some trends, such as increase in nose size, reflect genetic re- combinations, others, such as gross size increase, respond to environmental changes."

SOURCE : Angel, J. Lawrence, 1944, A racial analysis of the ancient Greeks: An essay on the use of morphological types, American Journal of Physical Anthropology

Link


Years later, after 2 decades of continued research, Angel would review another less reputable Greek anthropologist's work on the race of the ancient Greeks. Although Angel was certainly critical of that anthropologist's methodology; he did come to one very important agreement with him, and that is his conclusion on the continuity of the Greek people. 


Angel 1964 (page 343-344) states
"This he does in a rather unsystematic way by citing some findings from the many workers who have reported on skeletons from Greek territory. Perhaps inevitably he omits about half of the literature; it is not clear if it was available to him, especially if he wrote the book in Tashkent rather than Moscow. But the result is that he tends to overvalue speculations based on small samples as opposed to statistically tested changes. Never the less he is correct in pointing out that some regional “types” are largely derived from pre-Indo-European and from pre-Turkish populations, that there is complete continuity genetically from ancient to modern times, and that the major modern contrast among Greeks is between the groups from Eastern Anatolia and those from Greece and the Aegean. He is incorrect in the general conclusion that environmental change is never enough to create a new type: apparently meaning that selection cannot follow from environmental change."

SOURCE : Angel, J. Lawrence, 1964, The origin of the Hellenes. An ethnogenetic inquiry. Aris N. Poulianos. 160 pp, 5 tables, 9 maps, 32 photographs. 1962. Morphosis Press, Athens. Originally published in 1960 by the Institute of Ethnography of the Academy of Sciences of the U. S. S. R., translated into Greek by the author with special assistance of Nikos Antonopoulos, American Journal of Physical Anthropology, Volume 22, Issue 3, Date: September 1964, Pages: 343-345

Link 


Craniometric analysis


Modern craniometric data indicates the genetic continuity of the Greek people as well. A 1989 investigation showed
"A comparative cephalometric investigation was conducted between modern and ancient Greeks to determine craniofacial characteristics and to examine the significance of ethnic heritage. The modern sample was composed of 54 individuals chosen on the basis of ethnic background, normal occlusion and facial harmony. The ancient sample consisted of 40 skulls with normal occlusion dated back to the Minoan civilization (ca. 1,800-1,200 B.C.). A remarkable similarity in craniofacial morphology was revealed between the two groups, suggesting a close genetic affinity between modern and ancient Greeks. The ability of the craniofacial complex to make compensatory or balancing changes was noted. The craniofacial complex was seen to function as an integrated biological entity. Moreover, the cranial base showed a definite influence on skeletal profile configuration. These results provide a more comprehensive understanding of how craniofacial variables interact and contribute to the morphology of the dentofacial skeleton."

It should be noted here for accuracy's sake that the ancient sample is not from the Greek mainland nor from the classical era, but rather from Bronze age Crete.
"The material representing the ancient Greeks was drawn from the collection of crania in the museums of Herakleion and Chania, both located on the major Greek island, Crete.......The ancient Cretan skulls dated back to Minoan civilization, during the Bronze Age of 1,800-1,200 B.C."

While the modern sample constituted
"The sample of the modern Greeks consisted of 54 native Greek children (30 girls and 24 boys) born and reared in Athens and Pireaus (Greece) having an average age of 12 years."

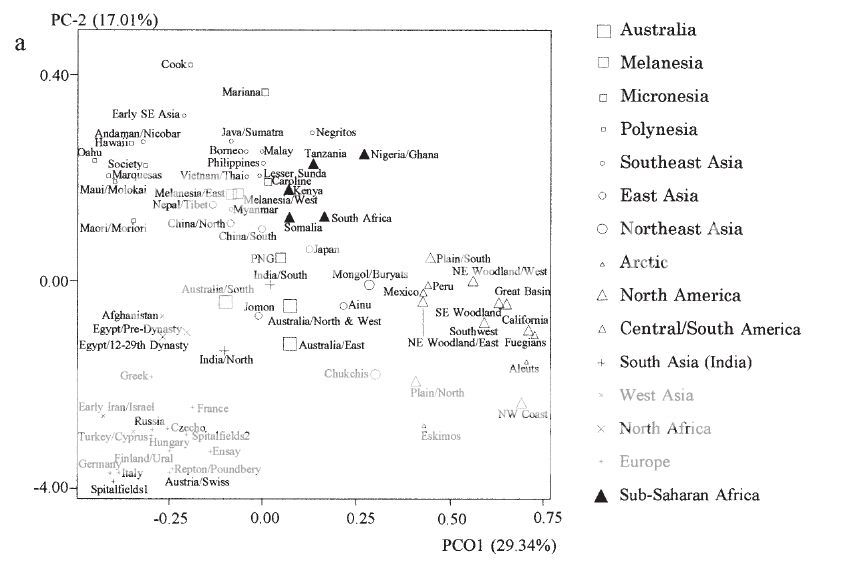
I suppose one could reasonably argue that just because modern southern Greeks from Athens and Pireaus show strong craniofacial similarities to ancient Bronze age Cretans, doesn't mean modern Greeks would show strong similarities to classical Greeks. However I disagree with strong objections, since another craniometric study done by French anthropologist Alain Froment from 1992 shows classical era Greek skulls to be pretty similar to Bronze age Cretan ones. See craniometric plot below by Froment for details.


SOURCE 1 :  Argyropoulos, E. et al., 1989, A comparative cephalometric investigation of the Greek craniofacial pattern through 4,000 years, Angle Orthod 1989 Fall;59(3):195-204

Link  PDF 

SOURCE 2 :  Froment, A. (1992). "Origines du Peuplement de l'Egypte Ancienne: l'Apport de l'anthropobiologie". Archéo-Nil. 2:79-98

PDF 


A more recent craniometric analysis indicated modern-ancient Greek genetic continuity as well as physical (craniofacial) similarity. Although the study did not rule out admixture from (physically/racially similar) outside populations, as it's well known that a significant minority of Slavs and Arvanites settled and assimilated into the Greek populace. 

"BACKGROUND: Multiple 20th century studies have speculated on the anthropological similarities of the modern inhabitants of Greece with their ancient predecessors. The present investigation attempts to add to this knowledge by comparing the craniofacial configuration of 141 ancient (dating around 2,000-500 BC) and 240 modern Greek skulls (the largest material among relevant national studies).

METHOD: Skulls were grouped in age at death, sex, era and geographical categories; lateral cephalograms were taken and 53 variables were measured and correlated statistically. The craniofacial measurements and measurements of the basic quadrilateral and cranial polygon were compared in various groups using basic statistical methods, one-way ANOVA and assessment of the correlation matrices. 

OBSERVATIONS: Most of the measurements for both sexes combined followed an akin pattern in ancient and modern Greek skulls. Moreover, sketching and comparing the outline of the skull and upper face, we observed a clock-wise movement. The present study confirms that the morphological pattern of Greek skulls, as it changed during thousands of years, kept some characteristics unchanged, with others undergoing logical modifications.

CONCLUSION: The analysis of our results allows us to believe that the influence upon the craniofacial complex of the various known factors, including genetic or environmental alterations, is apt to alter its form to adapt to new conditions. Even though 4,000 years seems too narrow a span to provoke evolutionary insights using conventional geometric morphometrics, the full presentation of our results makes up a useful atlas of solid data. Interpreted with caution, the craniofacial morphology in modern and ancient Greeks indicates elements of ethnic group continuation within the unavoidable multicultural mixtures."


SOURCE : Papagrigorakis, MJ. et al., 2014, Craniofacial morphology in ancient and modern Greeks through 4,000 years. Anthropologischer Anzeiger, Volume 71, Number 3, June 2014, pp. 237-257(21)

Link

Sunday, June 5, 2011

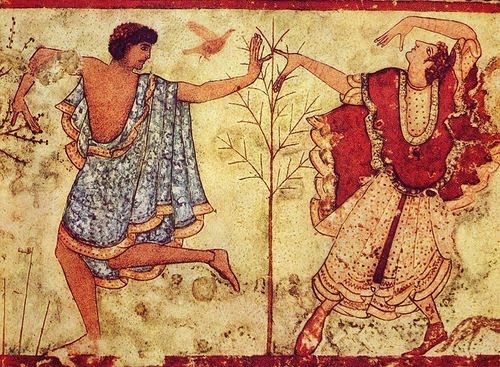
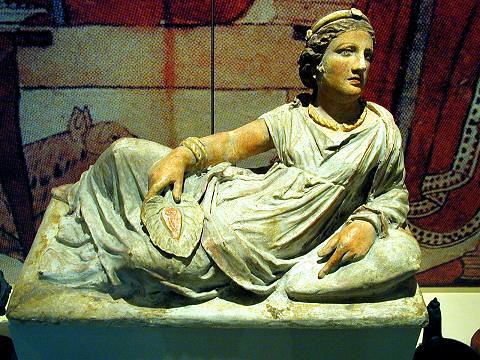
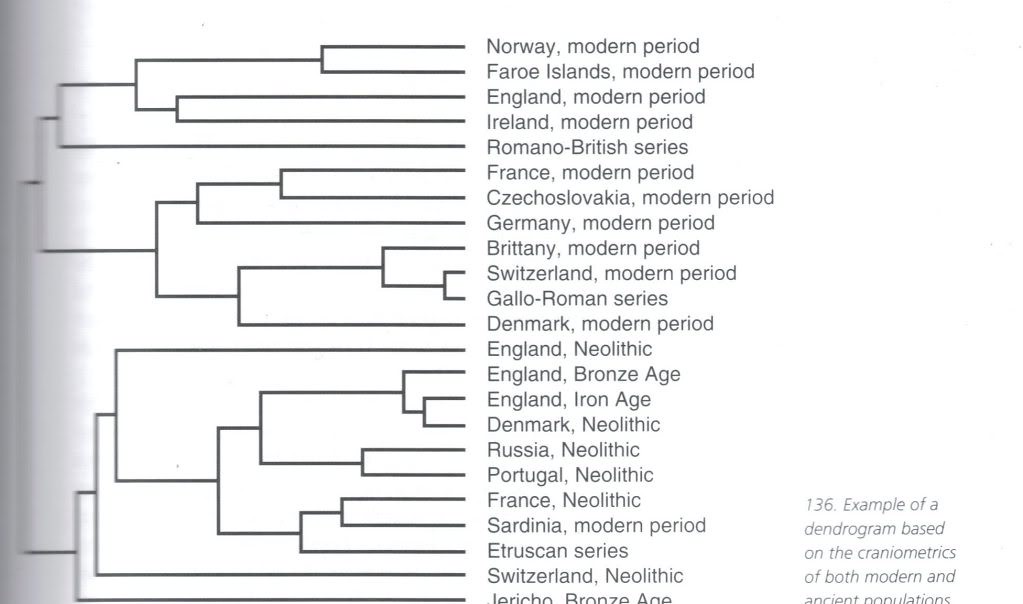
Craniometrics show ancient Etruscans group with modern Italians (Sardinians) before any group of modern Europeans.


The origin of the Etruscans is somewhat unclear still to this date. It's been shown that a good chunk of their mitochondrial lineages were from the East Mediterranean including what was likely Anatolia. Regardless of the still somewhat cloudy picture of their origins and ethnogenisis, craniometric data shows them to be related to contemporary Sardinians, and not to more Northerly European populations.


SOURCE : Brace CL and Tracer DP. 1992. Craniofacial continuity and change: A comparison of Late Pleistocene and recent Europe and Asia

Thursday, June 2, 2011

Caucasoid racial affinities of the ancient Egyptians.


The origin of the Nile valley civilization has been one of speculation for centuries. Broadly speaking they were a 'Caucasoid' population, related primarily to fellow Northern Africans, and secondly related to Middle Easterners and Europeans. They were not however related to Sub-Saharan Africans of Central, West, and South Africa (ie 'Negroids').


Cranio-facial patterns

1. Craniometric

"The biological affinities of the ancient Egyptians were tested against their neighbors and selected prehistoric groups as well as against samples representing the major geographic population clusters of the world. Two dozen craniofacial measurements were taken on each individual used. The raw measurements were converted into C scores and used to produce Euclidean distance dendrograms. The measurements were principally of adaptively trivial traits that display patterns of regional similarities based solely on genetic relationships. The Predynastic of Upper Egypt and the Late Dynastic of Lower Egypt are more closely related to each other than to any other population. As a whole, they show ties with the European Neolithic, North Africa, modern Europe, and, more remotely, India, but not at all with sub-Saharan Africa, eastern Asia, Oceania, or the New World. Adjacent people in the Nile valley show similarities in trivial traits in an unbroken series from the delta in the north southward through Nubia and all the way to Somalia at the equator. At the same time, the gradient in skin color and body proportions suggests long-term adaptive response to selective forces appropriate to the latitude where they occur. An assessment of “race” is as useless as it is impossible. Neither clines nor clusters alone suffice to deal with the biological nature of a widely distributed population. Both must be used. We conclude that the Egyptians have been in place since back in the Pleistocene and have been largely unaffected by either invasions or migrations. As others have noted, Egyptians are Egyptians, and they were so in the past as well."

SOURCE : Brace, C. L., D. P. Tracer, L. A. Yaroch, J. Robb, K. Brandt, and A. R. Nelson. 1993. Clines and Clusters Versus "Race": A Test in Ancient Egypt and the Case of a Death on the Nile. Yearbook of Physical Anthropology 36:1-31.

LINK  PDF


2. Cranial Non-metric

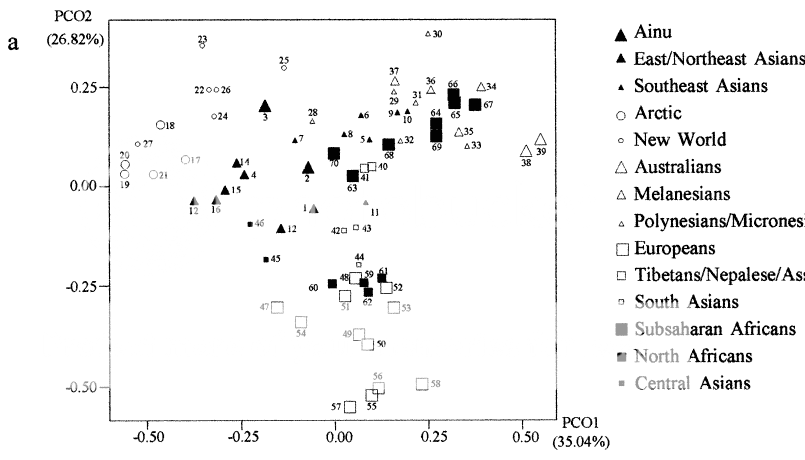
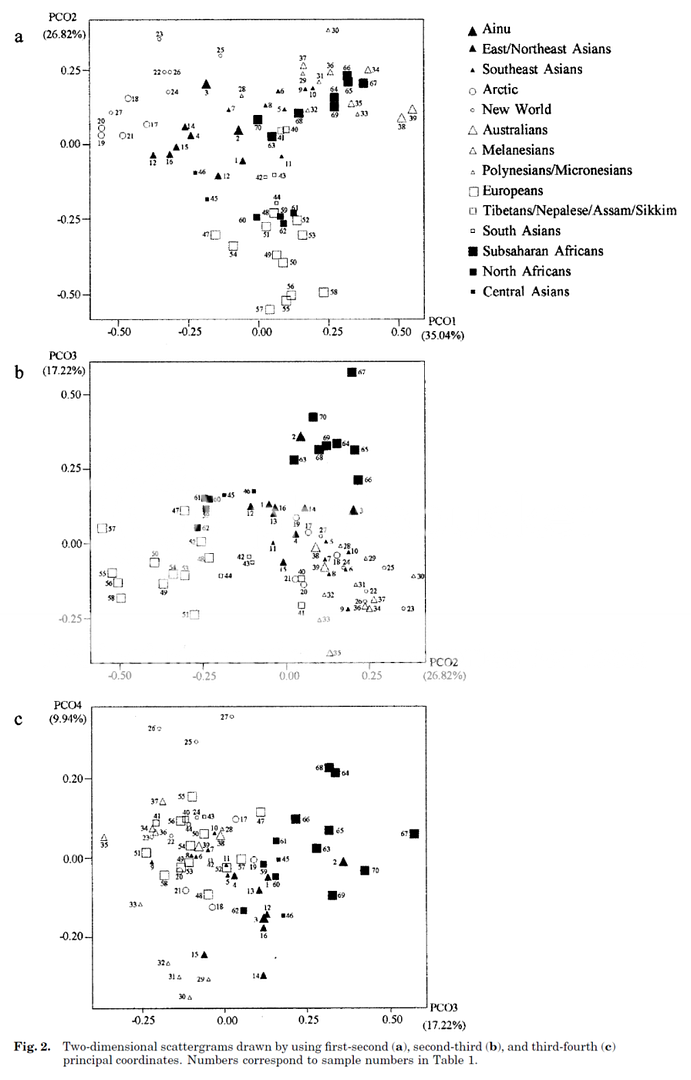
Pre-Dynastic Southern Egyptians from Naqada (#59), 26th-30th Dynasty Northern Egyptians from Gizeh (#60) cluster with Northwest Indians from Punjab and Kashmir (#44), Ancient and Modern Greeks (#48), Scandinavians from Finland, Sweden and Norway (#51, #52), and Modern Germans (#53).

Sample Set

Europeans
47. Russians 72–74 (74) 45–47 (41) Recent Russians (NHM, UC, MAE, MSU)
48. Greece 46–54 (20) 12–16 (4) Ancient and recent Greece (NHM)
49. Eastern Europeans 80–98 (52) 18–24 (16) Slav group: Poland, Czecho, Hergegovina, Bulgaria, and Yugoslavia (NHM)
50. Italy 131–146 (82) 42–47 (31) Recent Italians (NHM)
51. Finland/Ural 72–75 (35) 5–6 (2) Including a few samples of Ural-language people (NHM,MH)
52. Scandinavia 57–60 (30) 5 (3) Norwegians and Swedish (NHM, UC)
53. Germany 58–61 (44) 9–10 (7) Recent German (NHM, UC)
54. France 74–86 (23) 18–21 (0) Recent French (NHM, UC, MH)
UK series
55. Ensay 64–68 (58) 29–30 (30) Late Medieval to post-Medieval periods, Scotland (NHM)
56. Poundbury 97–109 (106) 46–52 (47) Late Roman period, Southwest England (NHM)
57. Spitalfields-1 122–135 (121) 104–113 (106) Mid-Victorian, London (NHM)
58. Spitalfields-2 73–74 (75) 17–19 (35) Pre-17th century, London (UC)
North Africans
59. Naqada 82–87 (57) 89–93 (39) Predynastic Egypt, ca. 5,000–4,000 BP (UC)
60. Gizeh 122–125 (91) 46–51 (32) 26th–30th Dynasty, Egypt, 664–343 BC (UC)
61. Kerma 114–132 (58) 79–92 (51) 12th–13th Dynasty of Nubia (UC)
62. Nubia 86–92 (39) 42–47 (9) Early Christian or Christian date Nubia (UC)
Subsaharan Africans
63. Somalia 58–64 (53) 10–12 (5) Erigavo District, Ogaden Somali (US)
64. Nigeria-1 74–83 (72) 65–76 (53) Ibo tribe (NHM, UC)
65. Nigeria-2 73–80 (17) 46–53 (7) Ashanti tribe (NHM, UC)
66. Gabon 82–86 (47) 55–57 (36) Fernand Vaz River (NHM, NMNH)
67. Tanzania 69–75 (54) 20–25 (17) Haya tribe, Musira Island, Lake Victoria (UC, NHM)
68. Kenya 71–82 (31) 55–63 (10) Bantu-speaking people from Kenya (UC, NHM)
69. South Africa 100–109 (53) 21–25 (8) Zulu and once called Kaffir tribes (UC, NHM, AMNH)
70. Khoisans 43–36 (28) 17–22 (13) Bushmans and Hottentots (NHM, UC, AMNH)

"Roughly three major constellations are evident. The Subsaharan African, Southeast Asian, and Oceanian samples form a cluster in one quadrant of Figure 2a. However, the Subsaharan African samples form a distinct grouping, well removed from the Southeast Asian and Oceanian samples on the third and fourth principal coordinates. In Figures 1 and 2, the Subsaharan African samples show significant separation from other regions, as well as diversity among themselves. The East/Northeast Asian and European samples form two additional discernable clusters. The New World and Arctic samples are peripheral subgroups in the large East/Northeast Asian cluster, and the two Ainu samples are outliers to other East Asians. The Central Asian samples are located between the Eastern Asian and European clusters. In the bottom half of Figure 2a, the South Asian samples are nearest to the center of all groups, the North African samples are a bit further removed, and the European samples are more separated, having the lowest scores on principal axis 2. Applying the neighbor-joining method to the MMD distances results in the dendrogram illustrated in Figure 3. The initial split, suggesting the greatest dissimilarity, is between Subsaharan Africans and the rest of the world. The Europeans, North Africans, and South Asians are then separated from the remaining groups. Oceania and the Southeast Asian groups form a separate branch that is separated from a large grouping of Central andEast/Northeast Asian, Arctic, and New World series clusters. The Arctic cluster, which includes groups from northeasternmost Siberia, is deep in a branch containing all New World groups. The Ainu samples are more similar to mainland groups from the Amur River basin and Lake Baikal than to the Japanese."
SOURCE : HANIHARA, TSUNEHIKO, HAJIME ISHIDA, AND YUKIO DODO. 2003. Characterization of biological diversity through analysis of discrete cranial traits. American Journal of Physical Anthropology 121:241-251.

LINK  PDF


3. Cranial Non-metric

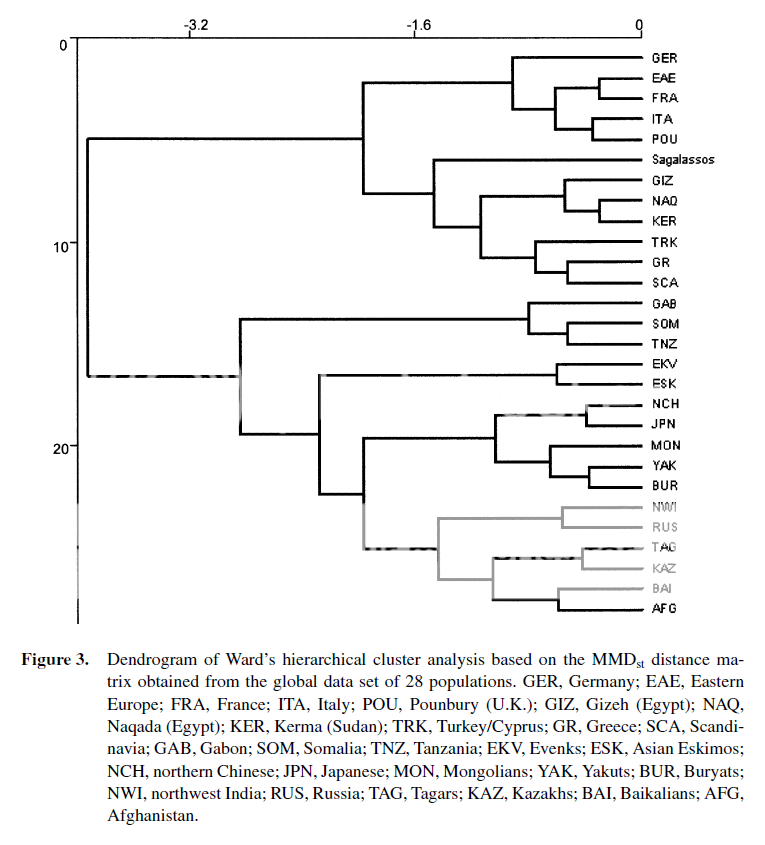
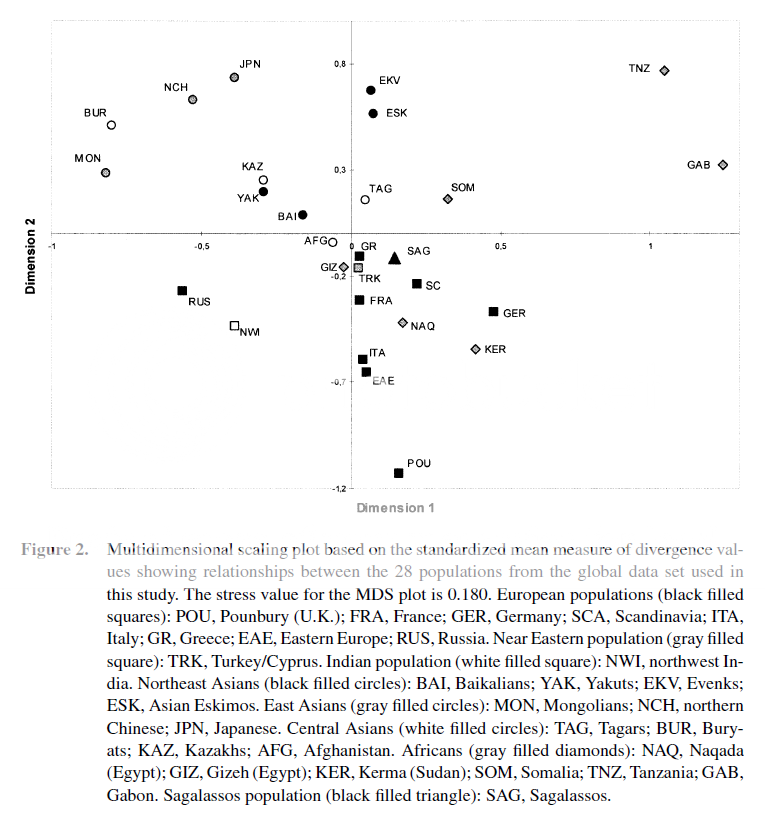
Pre-Dynastic Southern Egyptians from Naqada and late dynastic 26th-30th Dynasty Northern Egyptians from Gizeh cluster with Caucasoids [modern Europeans, ancient Byzantine Greeks, and modern Turks]. Note ancient Nubians from Kerma also cluster with Caucasoids and show strong ties with ancient pre dynastic Southern Egyptians. Also not modern sub-Saharan Africans including these East African Somalis do not.
"The dendrogram produced by Ward's clustering procedure for the global data set is shown in Figure 3 and provides a relatively similar representation of the MMD^sub st^ distance matrix than that provide by the MDS analysis. The populations clearly fall into two groups. The first main group can be broken down into two subgroups: (1) all the recent sub-Saharan populations and (2) mainly Central, East, and Northeast Eurasians. West Eurasians form the second main group, which is also subdivided into two subgroups. One of these subgroups includes all the eastern Mediterranean populations (three ancient Egyptian/Sudanese populations from Naqada, Gizeh, and Kerma as well as the Cypriot/Turkish, Greek, and Sagalassian populations) and the Scandinavian sample; the second subgroup includes the other West Eurasian populations."

SOURCE : Ricaut, F. X. and Waelkens, M (2008) "Cranial Discrete Traits in a Byzantine Population and Eastern Mediterranean Population Movements," Human Biology: Vol. 80: Iss. 5, Article 5.

LINK


Dental affinities

1. Dental Metric

Pre-Dynastic and 12th-29th Dynasty Egyptians cluster with modern Afghans and modern North Indians on the edge of a larger cluster of modern Europeans and modern West Asians.

It has been argued by Afrocentrists that dental data is insufficient because of  "tooth sized reduction" which indeed can undergo high change do to selective forces which have to do the diet of a population and other things, thus creating results that don't have much to do with genetic admixture or relatedness [for example see here]. However, in this study tooth size and it's effects were controlled and these relationships do indeed broadly match both cranio-facial and genetic data.
"It was asserted that tooth size has been exposed to strong natural selective force (Brace et al., 1991). It is true that overall tooth size plays a major role in odontometric variation, but when the effects of overall tooth size are eliminated with standardized data, several independent vectors with eigenvalues greater than 1.0 remain."
"Mesiodistal and buccolingual crown diameters of all teeth recorded in 72 major human population groups and seven geographic groups were analyzed. The results obtained are fivefold. First, the largest teeth are found among Australians, followed by Melanesians, Micronesians, sub-Saharan Africans, and Native Americans. Philippine Negritos, Jomon/Ainu, and Western Eurasians have small teeth, while East/Southeast Asians and Polynesians are intermediate in overall tooth size. Second, in terms of odontometric shape factors, world extremes are Europeans, aboriginal New World populations, and to a lesser extent, Australians. Third, East/Southeast Asians share similar dental features with sub-Saharan Africans, and fall in the center of the phenetic space occupied by a wide array of samples. Fourth, the patterning of dental variation among major geographic populations is more or less consistent with those obtained from genetic and craniometric data. Fifth, once differences in population size between sub-Saharan Africa, Europe, South/West Asia, Australia, and Far East, and genetic drift are taken into consideration, the pattern of sub-Saharan African distinctiveness becomes more or less comparable to that based on genetic and craniometric data. As such, worldwide patterning of odontometric variation provides an additional avenue in the ongoing investigation of the origin(s) of anatomically modern humans."

SOURCE : Hanihara T and Ishida H, (2005) Metric dental variation of major human populations American Journal of Physical Anthropology, Volume 128 Issue 2, Pages 287 - 298.

LINK 


2. Dental Non-metric

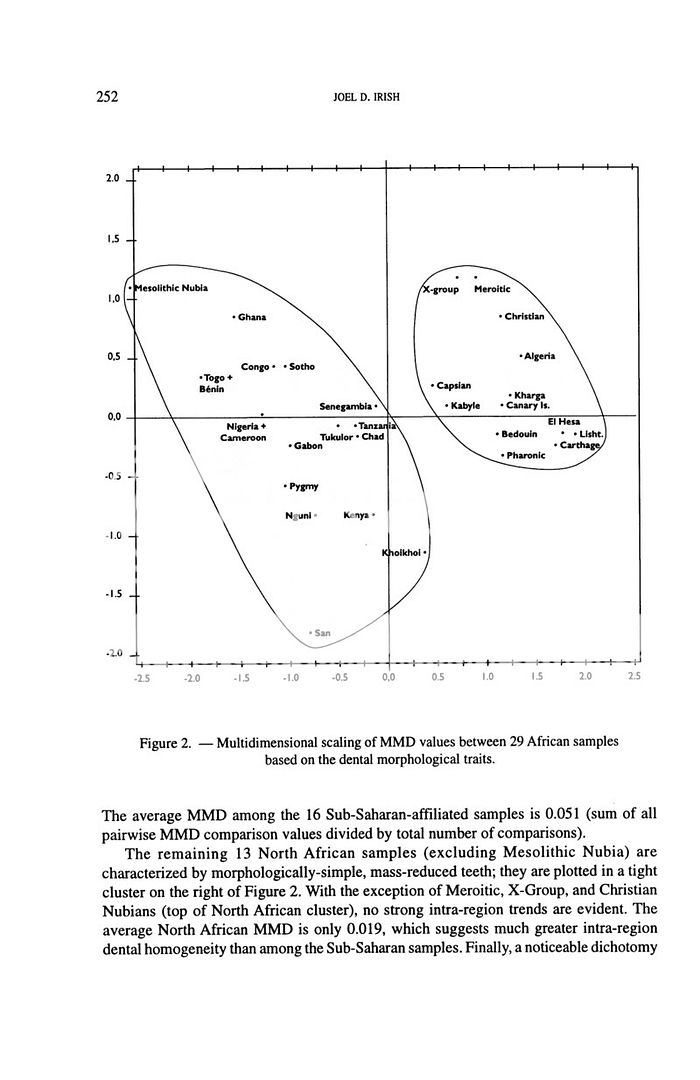
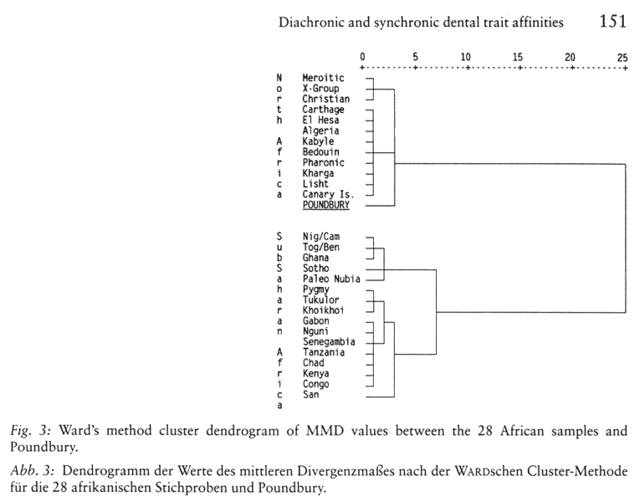
12th Dynasty Northern (Lisht), Roman/Byzantine (El Hesa), and Byzantine (Kharga) Egyptians cluster with other North Africans and Europeans (Poundbury, England).

"In several previous studies (e.g. IRISH 1993a, 1994, 1995, 1996, 1997) the biological affinities of Sub-Saharan and North African dental samples were estimated based on comparative analyses of morphological traits. A significant dichotomy between samples from the two geographic regions was revealed. However, intra-region trait homogeneity was observed, particularly within North Africa. Further analyses of the North Africans resulted in two additional findings. First, this homogeneity spans both space - from the Canary Islands to Egypt, and time - from recent Arabs and Berbers to West Asian-derived Carthaginians (751?-146 BC), 18th Dynasty (1575-1380 BC) Pharonic Nubians, and 12th Dynasty (1991-1783 BC) Egyptians. A small Capsian sample (ca. 8,500-5,000 BP) from Algeria and Tunisia also exhibits many trait similarities. Late Pleistocene Nubians (14,500-12,500 BP), however, are significantly different. Second, the post-Pleistocene North Africans are similar to Europeans in that they possess numerous dental features involving morphological simplification. Any North African deviations away from this pattern are in the direction of mass-additive Sub-Saharan traits. This finding supports the results of prior genetic-based studies that link North Africans to Europeans and western Asians, yet record several Sub-Saharan tendencies. Together, the two findings suggest that a morphologically simple dental pattern is shared by the indigenous peoples of North Africa, as well as Europe and perhaps western Asia, and this pattern has existed for the past 4,000 to perhaps 8,500+/- years."

SOURCE : Irish J.D. 1998b. Diachronic and synchronic dental trait affinities of late and post-pleistocene peoples from North Africa. Homo. 49(2) 138-155

LINK


Ancient Egyptians had simple, mass-reduced teeth like Caucasoids.
"However, all 15 samples exhibit morphologically simple, mass reduced dentitions that are similar to those in populations from greater North Africa (Irish, 1993, 1998a–c, 2000) and, to a lesser extent, western Asia and Europe (Turner, 1985a; Turner and Markowitz, 1990; Roler, 1992; Lipschultz, 1996; Irish, 1998a).Similar craniofacial measurements among samples from these regions were reported as well (Brace et al., 1993)"
SOURCE : Joel D. Irish (2006). Who Were the Ancient Egyptians? Dental Affinities Among Neolithic Through Postdynastic Peoples. Am J Phys Anthropol. 2006 Apr;129(4):529-43.

LINK  PDF 


This contrasts with the dental pattern of Sub-Saharan Africans who had massive complex teeth.
"Dentitions of Late Pleistocene Jebel Sahaba Nubians have extremely high frequencies of complex, mass-additive (and other) traits, including UI1 labial curvature, UI1 shoveling, Bushman Canine, UC distal accessory ridge, midline diastema, sixcusped LM1, LM2 Y-5, and LP1 Tome’s root. Furthermore, they exhibit low frequencies of typical North African features.This trait combination is ubiquitous in sub-Saharan Africans;(Irish & Turner, 1990; Irish, 1993, 1997, 1998a,b, for details)."
SOURCE : Irish, J.D., 2000. The Iberomaurusian enigma: North African progenitor or dead end? Journal of Human Evolution, 39(4), pp.393–410.

LINK


Forensic reconstruction of King Tut

Forensic anthropologists classify King Tut as being "Caucasian". 

May 10, 2005 
''Is this the true face of Tut? This silicone-skinned bust is billed as the most accurate forensic reconstruction ever of ancient Egypt's Pharaoh Tutankhamun. It was based on recent 3-D CT scans of the mummy of the "boy king," who is believed to have been about 19 when he died some 3,300 years ago. 
Led by Zahi Hawass, head of Egypt's Supreme Council of Antiquities, a National Geographic Society team commissioned French experts to create the lifelike bust. Using the CT scans (see "King Tut Mummy Scanned"), French forensic anthropologist Jean-Noël Vignal determined the basic measurements and features of Tutankhamun's face. Vignal deduced that Tutankhamun had a narrow nose, buck teeth, a receding chin, and Caucasian features. Such features are typical of European, North African, Middle Eastern, and Indian peoples. 
Paris-based forensic sculptor Elisabeth Daynès then created the bust shown above. She used Vignal's estimates of skin thickness and other data, plus wooden sculptures of Tut made in his youth. Soft-tissue features, such as the nose and ears, had to be guessed at, though within a scientifically determined range. Daynès based the skin tone on an average shade of Egyptians today and added the eyeliner that the king would have worn in life. 
Finally, National Geographic gave the CT data to a U.S. forensic team, who were to work "blind"—not knowing who the subject was. Their findings validated the French team's conclusions. And their plaster cast (see photo) turned out remarkably similar to the silicon bust. The reconstruction will be featured in the June issue of National Geographic, in the touring exhibit "Tutankhamun and the Golden Age of the Pharaohs," and on the National Geographic Channel's King Tut's Final Secrets, airing Sunday night." 
For the full story, see "King Tut's New Face: Behind the Forensic Reconstruction." 
See more pictures of the reconstruction.
—Ted Chamberlain
 LINK


EDIT 2017 - First Genome wide studies of Ancient Egyptian mummies!

Abstract 
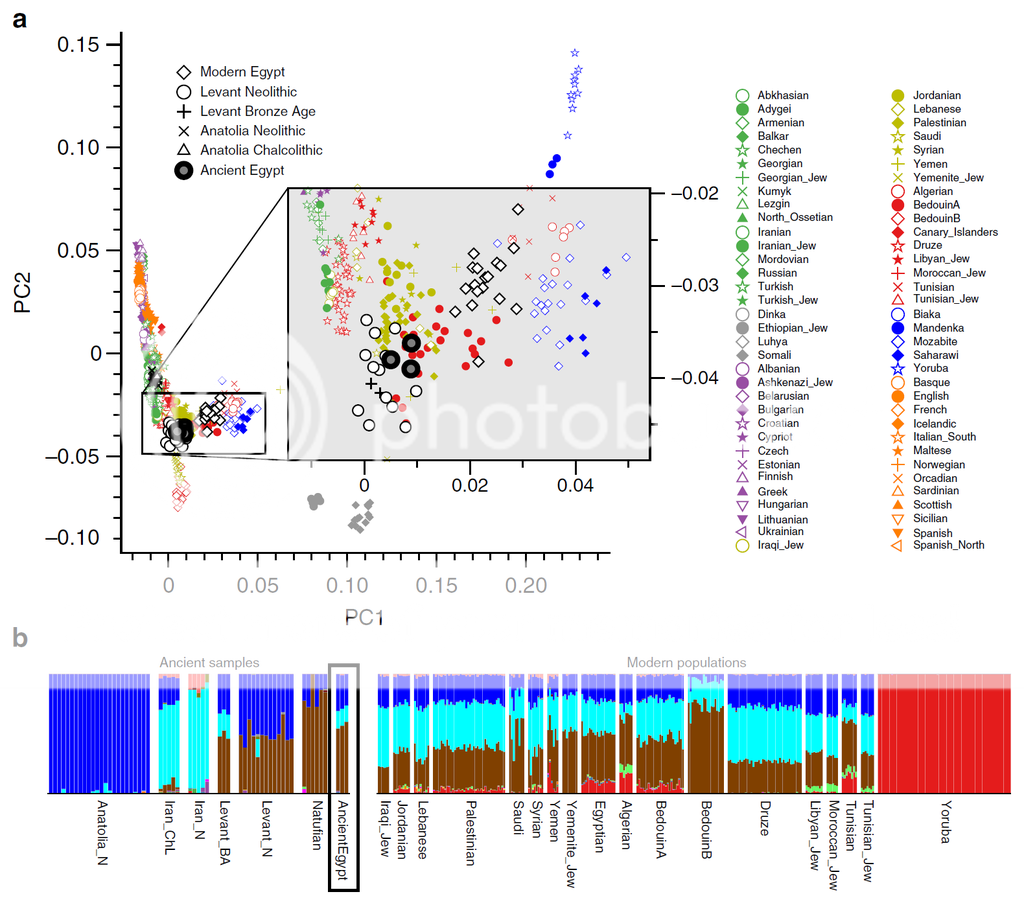
"Egypt, located on the isthmus of Africa, is an ideal region to study historical population dynamics due to its geographic location and documented interactions with ancient civilizations in Africa, Asia and Europe. Particularly, in the first millennium BCE Egypt endured foreign domination leading to growing numbers of foreigners living within its borders possibly contributing genetically to the local population. Here we present 90 mitochondrial genomes as well as genome-wide data sets from three individuals obtained from Egyptian mummies. The samples recovered from Middle Egypt span around 1,300 years of ancient Egyptian history from the New Kingdom to the Roman Period. Our analyses reveal that ancient Egyptians shared more ancestry with Near Easterners than present-day Egyptians, who received additional sub-Saharan admixture in more recent times. This analysis establishes ancient Egyptian mummies as a genetic source to study ancient human history and offers the perspective of deciphering Egypt’s past at a genome-wide level."
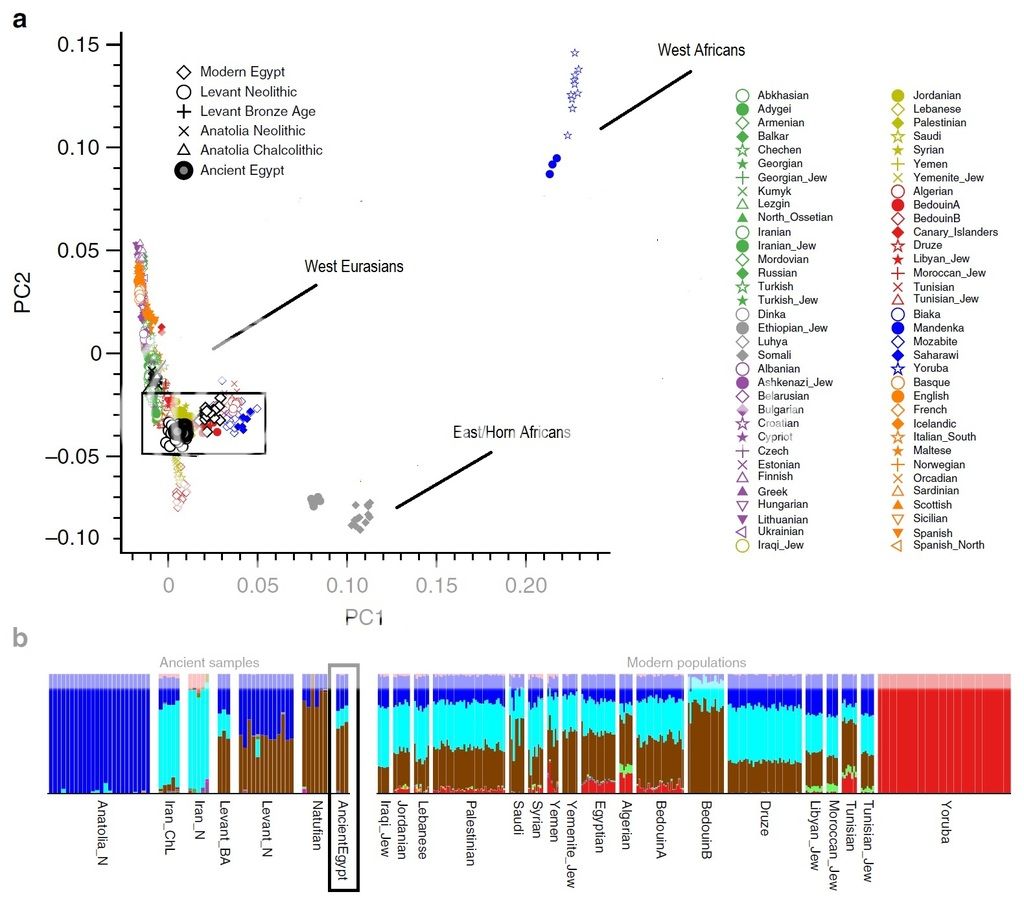
PCA plot in Figure a below reveals Ancient Egyptian clustering on a global scale. The magnified rectangle gives a detailed analysis of how the Ancient Egyptians cluster in a modern West Eurasian and North African context. 

Also ADMIXTURE analysis in Figure b reveals ancestral components that peak in Natufians, Neolithic Anatolians, and Neolithic Iranians..but do not exist in modern Sub-Saharan West Africans. Most modern North African samples, including modern Egyptians have a small but noticeable increase in Sub-Saharan ancestry [red] that ancient Egyptians and ancient Middle Easterners lacked during the Neolithic to Bronze age.


I thought I would edit the PCA and remove the magnified rectangle in Figure a for clarity. This gives us an idea how homogeneous the West Eurasian genetic cluster is, which includes present North Africans. It also demonstrates just how vast the differences are between the Ancient Egyptians and Modern Sub-Saharan groups. Even East Africans from the Horn such as Somalis show no strong ties to Ancient Egyptians.

SOURCE : Schuenemann et al. "Ancient Egyptian mummy genomes suggest an increase of Sub-Saharan African ancestry in post-Roman periods". Nature Communications, 2017.

LINK

Wednesday, May 18, 2011

Relationship between skull patterns and genes.

Here are 4 peer reviewed studies which show how cranio-facial patterns indicate genetic ancestry and similarity.


Race and global patterns of phenotypic variation

Relethford et al (2009).

"Phenotypic traits have been used for centuries for the purpose of racial classification. Developments in quantitative population genetics have allowed global comparison of patterns of phenotypic variation with patterns of variation in classical genetic markers and DNA markers. Human skin color shows a high degree of variation among geographic regions, typical of traits that show extensive natural selection. Even given this high level of geographic differentiation, skin color variation is clinal and is not well described by discrete racial categories. Craniometric traits show a level of among-region differentiation comparable to genetic markers, with high levels of variation within populations as well as a correlation between phenotypic and geographic distance. Craniometric variation is geographically structured, allowing high levels of classification accuracy when comparing crania from different parts of the world. Nonetheless, the boundaries in global variation are not abrupt and do not fit a strict view of the race concept; the number of races and the cutoffs used to define them are arbitrary. The race concept is at best a crude first-order approximation to the geographically structured phenotypic variation in the human species."
SOURCE : Relethford, J. H. (2009), Race and global patterns of phenotypic variation. American Journal of Physical Anthropology, 139: 16–22. doi: 10.1002/ajpa.20900

Link


Congruence of individual cranial bone morphology and neutral molecular affinity patterns in modern humans


Noreen von Cramon-Taubadel et al (2009).

Abstract

"Recent studies have demonstrated that the shape of the human temporal bone is particularly strongly correlated with neutral genetic expectation, when compared against other cranial regions, such as the vault, face, and basicranium. In turn, this has led to suggestions that the temporal bone is particularly reliable in analyses of primate phylogeny and human population history. While several reasons have been suggested to explain the temporal bone's strong fit with neutral expectation, the temporal bone has never systematically been compared against other individual cranial bones defined using the same biological criteria. Therefore, it is currently unknown whether the shapes of all cranial bones possess reliable information regarding neutral genetic evolution, or whether the temporal bone is unique in this respect. This study tests the hypothesis that the human temporal bone is more congruent with neutral expectation than six other individual cranial bones by correlating population affinity matrices generated using neutral genetic and 3D craniometric data. The results demonstrate that while the temporal bone shows the absolute strongest correlation with neutral genetic data compared with all other bones, it is not statistically differentiated from the sphenoid, frontal, and parietal bones in this regard. Potential reasons for the temporal bone's consistently strong fit with neutral expectation, such as its overall anatomical complexity and/or its contribution to the architecture of the basicranium, are examined. The results suggest that future phylogenetic and taxonomic studies would benefit from considering the shape of the entire cranium minus those regions that deviate most from neutrality."
SOURCE : Von Cramon-Taubadel N (in press) Congruence of individual cranial bone morphology and neutral molecular affinity patterns in modern humans. Am J Phys Anthropol. doi 10.1002/ajpa.21041.

Link


The questionable contribution of the Neolithic and the Bronze Age to European craniofacial form


C. Loring Brace et al (2005).

"Many human craniofacial dimensions are largely of neutral adaptive significance, and an analysis of their variation can serve as an indication of the extent to which any given population is genetically related to or differs from any other. When 24 craniofacial measurements of a series of human populations are used to generate neighbor-joining dendrograms, it is no surprise that all modern European groups, ranging all of the way from Scandinavia to eastern Europe and throughout the Mediterranean to the Middle East, show that they are closely related to each other."
SOURCE : C. Loring Brace et al. The questionable contribution of the Neolithic and the Bronze Age to European craniofacial formProc Natl Acad Sci U S A. 2006 January 3; 103(1): 242–247. Published online 2005 December 21. doi: 10.1073/pnas.0509801102

Link PDF


Characterization of biological diversity through analysis of discrete cranial traits

Hanihara et al. (2003)

"In the present study, the frequency distributions of 20 discrete cranial traits in 70 major human populations from around the world were analyzed. The principal-coordinate and neighbor-joining analyses of Smith's mean measure of divergence (MMD), based on trait frequencies, indicate that 1). the clustering pattern is similar to those based on classic genetic markers, DNA polymorphisms, and craniometrics;2). significant interregional separation and intraregional diversity are present in Subsaharan Africans; 3). clinal relationships exist among regional groups; 4). intraregional discontinuity exists in some populations inhabiting peripheral or isolated areas. For example, the Ainu are the most distinct outliers of the East Asian populations. These patterns suggest that founder effects, genetic drift, isolation, and population structure are the primary causes of regional variation in discrete cranial traits. Our results are compatible with a single origin for modern humans as well as the multiregional model, similar to the results of Relethford and Harpending ([1994] Am. J. Phys. Anthropol. 95:249-270). The results presented here provide additional measures of the morphological variation and diversification of modern human populations. Copyright 2003 Wiley-Liss, Inc."
SOURCE : HANIHARA, TSUNEHIKO, HAJIME ISHIDA, AND YUKIO DODO. 2003. Characterization of biological diversity through analysis of discrete cranial traits. American Journal of Physical Anthropology 121:241-251.

Link PDF