Above : Pictures of Venice Italy
It is often stated that Northern Italians are "Germanic" (don't know why they single out Northern Italians as Germanic 'barbarians' also invaded and controlled the south of Italy and Sicily in historic times), or more related to Germans and Northern Europeans than to the Southern Italians or other Southern Europeans; this notion however is completely incorrect. More recent genome wide association studies generally show Northern Italians clustering with Southern Europeans, pulling further south and distant from Northern Europeans than Spaniards. Here are several genetic studies demonstrating this fact.
European Population Substructure: Clustering of Northern and Southern Populations. Seldin et al (2006).
"Using a genome-wide single nucleotide polymorphism (SNP) panel, we observed population structure in a diverse group of Europeans and European Americans. Under a variety of conditions and tests, there is a consistent and reproducible distinction between “northern” and “southern” European population groups: most individual participants with southern European ancestry (Italian, Spanish, Portuguese, and Greek) have >85% membership in the “southern” population; and most northern, western, eastern, and central Europeans have >90% in the “northern” population group. Ashkenazi Jewish as well as Sephardic Jewish origin also showed >85% membership in the “southern” population, consistent with a later Mediterranean origin of these ethnic groups. Based on this work, we have developed a core set of informative SNP markers that can control for this partition in European population structure in a variety of clinical and genetic studies."
The recent development of methodologies for defining population structure has provided the ability to identify the major ethnic contributions in individual participants in diverse populations. These statistical approaches utilize non-hierarchical clustering algorithms in which Markov chain Monte Carlo methods are used to infer ancestry, based solely on genotyping information. Furthermore, related algorithms provide methods for controlling for population stratification in genetic studies. These methods are important in assessing the results of case-control and other non–family-based association tests. In addition, defining population structure is potentially useful both in clinical outcome studies and in the examination of pharmacologic response and toxicity. Previous studies of human population structure have primarily considered different continental populations or admixed populations between two or more different continental populations. However, some of these studies have also suggested that sub-continental differences in population structure can be discerned. The examination of population differences within Europe using mitochondrial or Y chromosome haplogroups has been particularly useful in tracing part of the routes of migration and populating of Europe, but these haplogroups do not provide strong inferences on population genetic structure. Autosomal studies using small numbers of classical genetic markers (nuclear protein polymorphisms) have suggested broad genetic gradients across Europe, leading to the proposal of demic diffusion models. These include a principal component analysis of small numbers of classic genetic markers that suggested three clines accounting for a proportion of the genetic variation in the continent.
A total of 1,094 participants were genotyped with more than 5,700 SNPs distributed over the entire genome. After excluding participants with > 10% estimated non-European ancestry (see Methods), 928 participants were selected for further analysis.
Populations studied: First sample set.
European Americans of different regional European origins (681 participants), East Asian Americans (13), African Americans (22), South Asian Americans (48), Amerindians (48), and Swedish (92), Finnish (13), Italian (91), Portuguese (3), southern France (1), and Spanish participants (82) were included in this study. None of the individuals were first-degree relatives of other participants in the study. These populations were based on self-identified ethnic affiliation. The European Americans, African Americans, and East Asian Americans were recruited from across the United States, and the majority of the participants, including all of the European Americans, were RA probands identified as part of the North American Rheumatoid Arthritis Consortium (NARAC) as previously described (61). The South Asian American participants were recruited from Houston, Texas, and Amerindian participants were self-identified as Mayan (Kachiquel language group) and were recruited in Chimaltenango, Guatemala, as previously described. The Italian participants were normal healthy volunteers recruited from throughout Italy: 38 from northern Italy, 23 from central Italy, and 30 from southern Italy. The Swedish and Finnish participants were healthy normal controls collected in these countries. The other participants recruited in southwestern Europe included 86 from Spain, three from Portugal, and one from southern France. Of the Spanish participants, there were 43 from northern Spain, 12 from central Spain, and 19 from southern Spain. Of these participants from Spain and Portugal, 61 were probands for a multiple sclerosis study. Blood cell samples were obtained from all individuals, according to protocols and informed-consent procedures approved by institutional review boards, and were labeled with an anonymous code number linked only to demographic information.
For the European Americans, grandparental information was available for the majority of the participants. These included the following self-identifier classifications of grandparents: western European (United Kingdom, northern France, Holland, Belgium, and Switzerland), eastern European (Russia, Poland, Romania, Ukraine, Lithuania, Latvia, Estonia, and Czech Republic), central European (Germany, Austria, and Hungary), southern European (Spain, Portugal, Italy, and southern France), Scandinavian (Denmark, Norway, Sweden, and Finland), and eastern Mediterranean (Greece, Turkey, Croatia, Bosnia, Yugoslavia, and Albania), Sephardic Jewish American, and White French Canadian. All participants with any reported mixed-continental origins (e.g., African) were excluded".
"Grouping of individuals with different north–south contributions from the k = 2 analysis further illustrates this division of individual participants from different European population sets and some of the variability observed (Figure 2). Italy (84 of 86 individuals), Spain (66 of 74), Portugal (3 of 3), and Sephardic Jewish Americans (3 of 3) had majority contributions from the “southern” population group as defined by this population structure analysis. In addition, a large fraction of southern European Americans (7 of 11) without other reported European heritage had majority “southern” contribution. Those Americans with self-identified mixed “southern” and “northern” heritage showed a substantial but less impressive “southern” population component (8 of 23 with majority “southern”). Those American participants with mixed eastern Mediterranean–reported heritage also had two of ten individuals with a majority “southern” population component. All other groups showed only a few isolated participants with more than a limited “southern” population component. Trends in both the Italian and Spanish participants were also consistent with this north–south pattern: ten of 32 participants from northern Italy had greater than a 10% “northern” component compared with two of 28 from southern Italy; and 23 of 43 from northern Spain had greater than a 10% “northern” contribution compared to five of 19 from southern Spain."Analyses were performed with 2,657 SNPs under the condition of two population (Pop) groups (k = 2)."
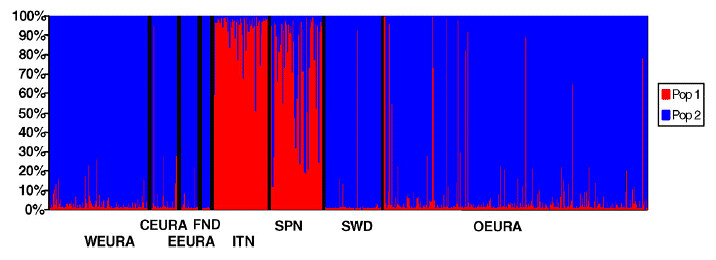 FIGURE 1 Analysis of Population Structure in Participants of European Ancestry"Analysis was performed without any prior population assignment using STRUCTURE. The European ancestry groups, western European American (WEURA), central European American (CEURA), eastern European American (EEURA), Finland (FND), Italy (ITN), Spain (SPN), Sweden (SWD), and other European American (OEURA) are indicated by color code. The latter group consisted of individuals with mixed European ancestry from several regions and additional smaller groups (see Methods)....In (D), the proportion of each cluster (ordinate) is shown for each individual."
As we see above, each little line represents 1 Italian. As we can see, the Italians are scorching red here, even the Northern Italians; it looks like 1 (possibly although not certainly Northern) Italian is half blue.
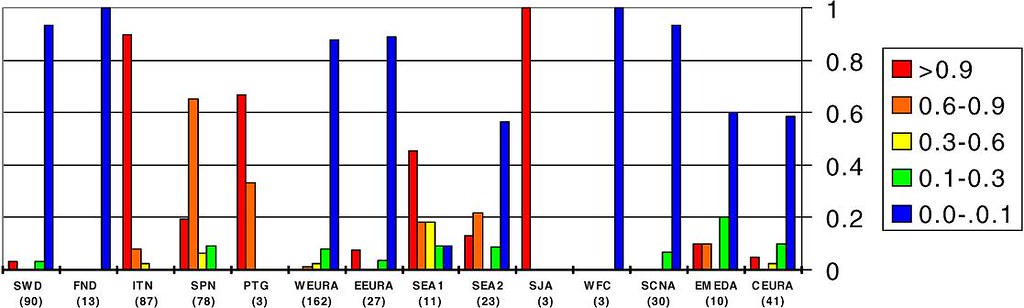 FIGURE 2 - Distribution of “Southern” Population Components among Participants with Various Self-Identified Ethnic or Regional European Origins
"For each self-identified group, the fraction of individual participants in each group with the color-coded frequency “southern” contribution is shown. For southern European American I (SEA1), only southern European grandparents were identified. For southern European American II (SEA2), grandparents were self-reported as being of both southern European decent and western, central, or eastern European decent. For the eastern Mediterranean American (EMEDA) group, four of ten were of mixed-European decent with one or more grandparents of western, central, or eastern European decent.
CEURA, central European American; EEURA, eastern European American; FND, Finland; ITN, Italy; PTG, Portugal; SCNA, Scandinavian; SJA, Sephardic Jewish American; SPN, Spain; SWD, Sweden; WEURA, western European American; WFC, White French Canadian."
As we can see above, the Italians (38 of 87 of whom are Northern Italians) are scorching red (90%+ 'Southern'), only a minority are orange (60-90% 'southern'), while none are entirely or predominately in the blue (Northern) cluster. There are more Swedes (1 outlier) who are in predominately 'Southern' cluster than Italians who are predominantly in the 'Northern' cluster.
So yes, virtually every Northern Italian clustered predominantly in the 'Southern' cluster, while only 10 of 32 Northern Italians showed less than a 90% contribution to the 'Southern' cluster (compared to 23 of 43 from Northern Spain, and 5 of 19 from Southern Spain), and only 2 of 28 participants from Southern Italy had less than a 90% contribution to the 'Southern' cluster. The remaining Italians were between 60% and 90% in the Southern cluster. Northern Italians are overwelmingly 'Southern' in biological affinity when speaking in a European wide context; Southern Italians more-so, but Spaniards slightly less.
SOURCE : Seldin MF, Shigeta R, Villoslada P, Selmi C, Tuomilehto J, et al. (2006) European Population Substructure: Clustering of Northern and Southern Populations. PLoS Genet 2(9): e143. doi:10.1371/journal.pgen.0020143
Refinement of ancestry informative markers in Europeans. Tian et al (2009).
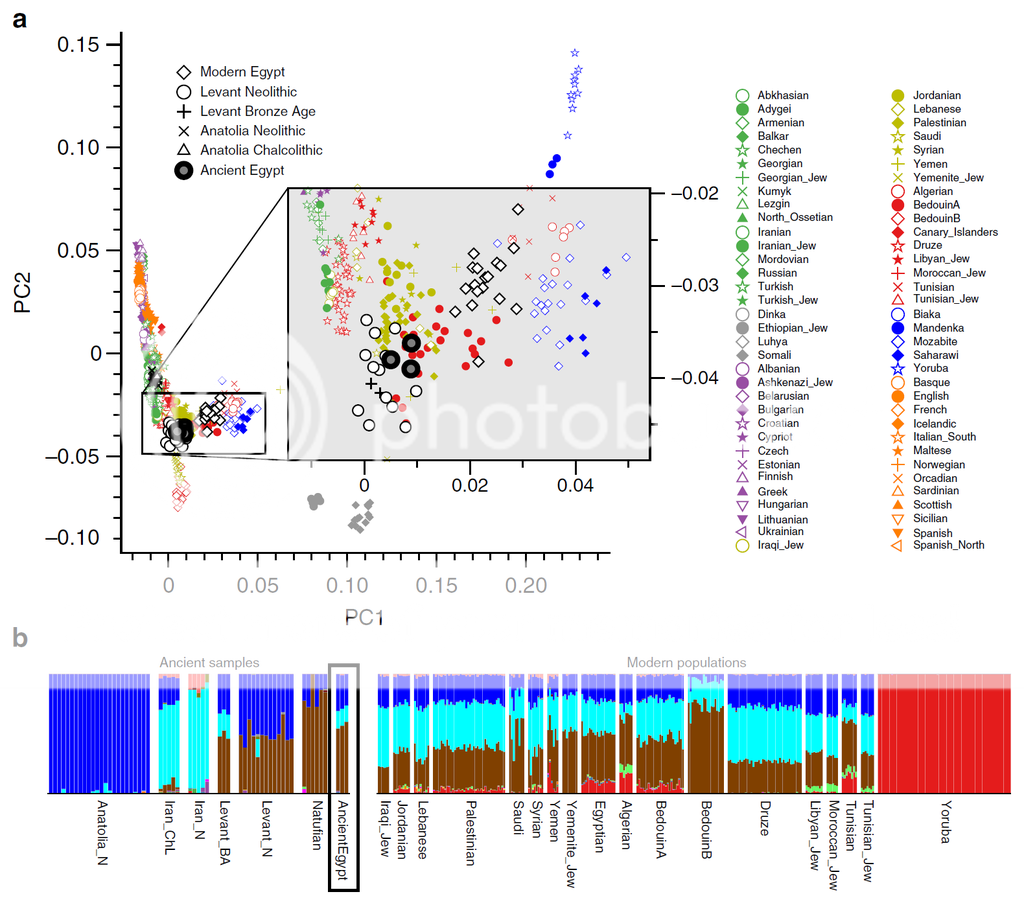
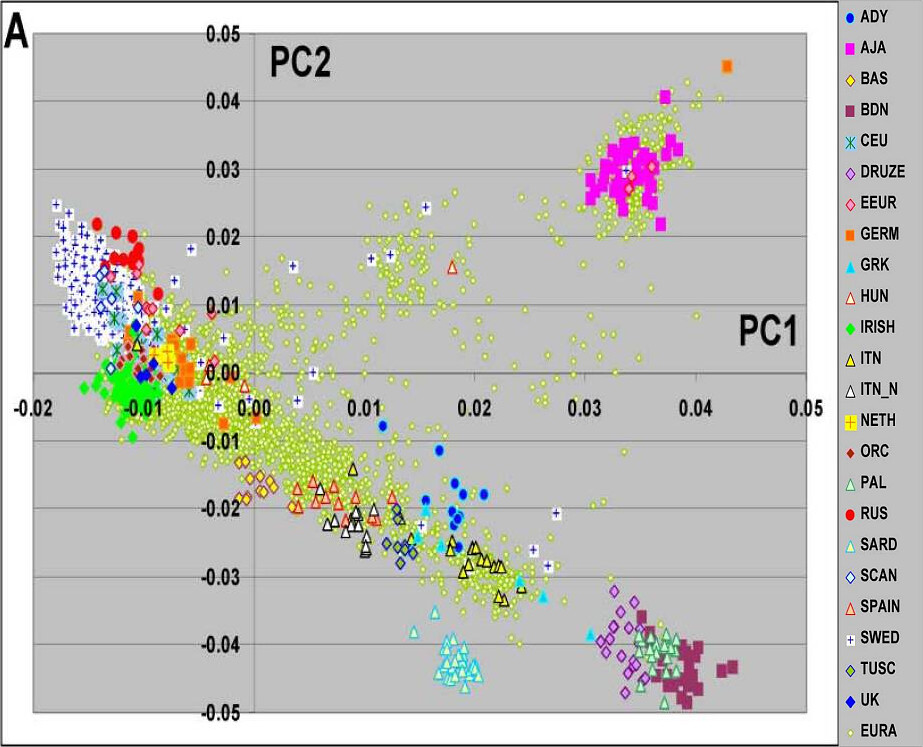 "Figure 1. Principal component analyses of substructure in a diverse set of subjects of European descent. Graphic representation of the first two PCs based on analysis with >250K SNPs are shown. Color code shows subgroup of subjects for each population group.
The subjects included Adygei (ADY, 12 subjects), Ashkenazi Jewish American (AJA, 40 subjects), Basque (BAS, 12 subjects), Bedouin (BDN, 23 subjects), CEPH European American (CEU, 48), Druze (20 subjects), Eastern European American (EEUR, 11 subjects), German American (GERM, 17 subjects), Greek American (GRK, 7), Hungarian American (HUN, 4 ), IRISH (84 subjects), Italian American (ITN, 20 subjects), northern Italian (ITN_N, 13 subjects), Dutch American (NETH, 3 subjects), Orcadian (ORC, 14 subjects), Palestinian (PAL, 22 subjects), Russian (RUS, 13 subjects), Sardinian (SARD, 28 subjects), Scandinavian American (SCAN, 6 subjects ), Spanish (SPAIN, 12 subjects), Swedish (SWED, 591 subjects), Tuscany (TUSC, 8 subjects), and United Kingdom American (UK, 5 subjects). Each of the specific country or ethnic color coded origins had consistent 4 grandparent origin information. The total number of individuals in this analysis was 4446. In panel A European Americans (EURA) without 4 grandparental information are shown (contains both NYCP and CHOP). Panels B and C illustrate the distribution of the EURA from NYCP (1873 subjects) and CHOP (1488 subjects), respectively."
The lack of important European groups like the French and Swiss does seem to make the gap between Southern Europe and Northern/Central/Eastern Europe very large and not just gradual or clinal, but if those two populations were to be included the gap from Southern Europe to Central Europe would appear less significant with the alps showing a large (but not massive) barrier. Anyway, this study also irrefutably proves the Southern European biological affinities of Northern Italians and that is what is important.
Also, here is an interesting Fst genetic distance table from the study, although it unfortunately doesn't include Northern Italians it does include Tuscans (ie where the Renaissance first sprung up).
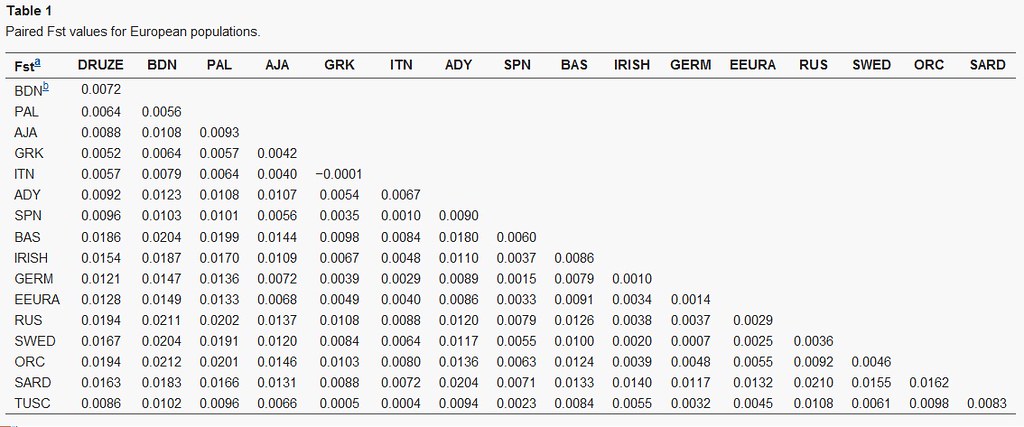 The results as seen in Table 1.
Link
The genetic article which that book used as a source for that statement is Piazza's "A Genetic History of Italy", and although unfortunately I don't have access to the entire study, the abstract is available online. It's conclusions are clear that the biological stratification seen in today's Italy is reflective of pre Roman times.
Link
(EDIT 2015) Admixture ratios in modern populations based on prehistoric genomes
All populations in Europe can be modeled as being a mixture of 3 major and distinct ancestral strains from prehistoric migrations. These are
1. Paleolithic West European Hunter Gatherers
2. Early European Farmers of the Neolithic revolution who had most their genetic origin in Mesolithic and Neolithic Anatolia and brought the earliest agricultural practices to Europe.
3. Early Bronze age Yamnaya steppe pastoralists from the Pontic-Caspian steppe, who's ancestors were the first to domesticate the horse. They were also one of the first groups on Earth who knew of and used wheeled vehicles. The Yamnaya steppe pastoralists are believed by most linguists to have been the speakers of the late stage proto Indo-European language (see Kurgan hypothesis).
As we can see in Figure 3 below, all Europeans can basically be modeled as a composite of the same 3 ancestral mixtures, it's just that the ratios are different. We can also see that that the biggest differences in Europe are between the North of Europe, and the South of Europe. As we can see in their admixture ratios, the Northern Italians (here represented by a sample set from Bergamo Lombardy) are unsurprisingly most similar to other Southern Europeans (ie Northern Spanish, Greeks, Albanians, Bulgarians, etc) in their admixture ratios, and that is being of heavy Early Neolithic Farmer ancestry. Tuscans as anyone can see also come out very heavily Neolithic.

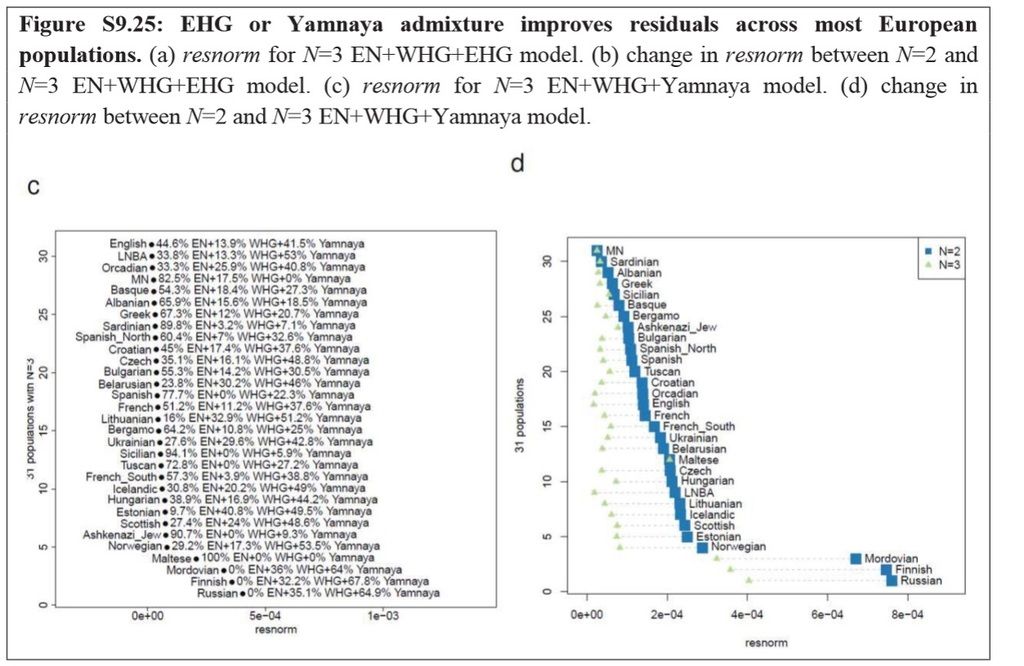
SOURCE : Haak, et al. (2015). "Massive migration from the steppe was a source for Indo-European languages in Europe". Nature. doi:10.1038/nature14317.edit
Link
Summary and conclusions
1. Northern and Central Italians are biologically SOUTHERN European...broadly speaking. In so far that they share their overall closest genetic relationships with other Southern Europeans, and that they are more distinct from Northern European groups than the Spanish.
2. Northern-Central Italians may be a bit closer to North/Central/East Europeans than Southern Italians are (just as Southern Germans are a bit closer to Southern Europeans than Northern Germans are), but Northern-Central Italians still biologically pull to Southern Europe quite strongly as seen that they ALWAYS pull further south than Spaniards, and also one study showed them a bit below Balkan Southern Slavs like Bulgarians. They also always structure with Southern Europeans in European exclusive STRUCTURE analysis studies. And their admixture ratios based on actual ancient genomes using formal admixture modeling is much more similar to the ratios present in other Southern Europeans than in Northern Europeans.
3. Slight Germanic admixture is possible for all Italian populations, not just the Northern Italians. I would venture that actual Germanic ancestry is larger in Northern Italy and that the Lombards in Northern Italy had a bigger impact than the Goths or Normans in Southern Italy. However one thing is for certain, and that is that large scale Germanic admixture in any Italian groups is certainly not the case and easily refuted by the data. Anything beyond that is total conjecture at this point.
4. There is a noticeable difference between the Northern Italians and Southern Italians, and I don't want people to think that Northern Italians cannot be argued to be a genetically distinct. Also, the genetic distance between Northern and Southern Italians, although pretty large from a single European 'nationality' point of view, is only roughly equal [marginally greater] to that of the genetic distance between Northern Germans and Southern Germans.
"The definition of European population genetic substructure and its application to understanding complex phenotypes is becoming increasingly important. In the current study using over 4,000 subjects genotyped for 300,000 single-nucleotide polymorphisms (SNPs), we provide further insight into relationships among European population groups and identify sets of SNP ancestry informative markers (AIMs) for application in genetic studies. In general, the graphical description of these principal components analyses (PCA) of diverse European subjects showed a strong correspondence to the geographical relationships of specific countries or regions of origin. Clearer separation of different ethnic and regional populations was observed when northern and southern European groups were considered separately and the PCA results were influenced by the inclusion or exclusion of different self-identified population groups including Ashkenazi Jewish, Sardinian, and Orcadian ethnic groups. SNP AIM sets were identified that could distinguish the regional and ethnic population groups. Moreover, the studies demonstrated that most allele frequency differences between different European groups could be controlled effectively in analyses using these AIM sets. The European substructure AIMs should be widely applicable to ongoing studies to confirm and delineate specific disease susceptibility candidate regions without the necessity of performing additional genome-wide SNP studies in additional subject sets."
 "Figure 1. Principal component analyses of substructure in a diverse set of subjects of European descent. Graphic representation of the first two PCs based on analysis with >250K SNPs are shown. Color code shows subgroup of subjects for each population group.
The subjects included Adygei (ADY, 12 subjects), Ashkenazi Jewish American (AJA, 40 subjects), Basque (BAS, 12 subjects), Bedouin (BDN, 23 subjects), CEPH European American (CEU, 48), Druze (20 subjects), Eastern European American (EEUR, 11 subjects), German American (GERM, 17 subjects), Greek American (GRK, 7), Hungarian American (HUN, 4 ), IRISH (84 subjects), Italian American (ITN, 20 subjects), northern Italian (ITN_N, 13 subjects), Dutch American (NETH, 3 subjects), Orcadian (ORC, 14 subjects), Palestinian (PAL, 22 subjects), Russian (RUS, 13 subjects), Sardinian (SARD, 28 subjects), Scandinavian American (SCAN, 6 subjects ), Spanish (SPAIN, 12 subjects), Swedish (SWED, 591 subjects), Tuscany (TUSC, 8 subjects), and United Kingdom American (UK, 5 subjects). Each of the specific country or ethnic color coded origins had consistent 4 grandparent origin information. The total number of individuals in this analysis was 4446. In panel A European Americans (EURA) without 4 grandparental information are shown (contains both NYCP and CHOP). Panels B and C illustrate the distribution of the EURA from NYCP (1873 subjects) and CHOP (1488 subjects), respectively."
As we can see by PCA analysis, Tuscans (TUSC) and Northern Italians (ITL N) group well within the Southern European cluster, far away from the Northern/Central/East European cluster. Italian Americans (ITN) with 4 Italian grandparents of Southern Italian/Sicilian origin overlap with the Greeks, while Northern Italians (ITL N) seem to be smack dab in the middle of the Southern European cluster, between Spaniards and Tuscans. Tuscans also pull even further south than the Northern Italians, between Southern Italians/Greeks and Northern Italians.
The lack of important European groups like the French and Swiss does seem to make the gap between Southern Europe and Northern/Central/Eastern Europe very large and not just gradual or clinal, but if those two populations were to be included the gap from Southern Europe to Central Europe would appear less significant with the alps showing a large (but not massive) barrier. Anyway, this study also irrefutably proves the Southern European biological affinities of Northern Italians and that is what is important.
Also, here is an interesting Fst genetic distance table from the study, although it unfortunately doesn't include Northern Italians it does include Tuscans (ie where the Renaissance first sprung up).
 The results as seen in Table 1.
Tuscany to Southern Italy - 0.0004
Tuscany to Greece - 0.0005
Tuscany to Germany - 0.0032
Tuscany to Ireland - 0.0055
Tuscany to Sweden - 0.0061
Tuscany to Russia - 0.0108
SOURCE : Tian et al. (2009). European Population Genetic Substructure: Further Definition of Ancestry Informative Markers for Distinguishing Among Diverse European Ethnic Groups. Mol Med; doi: 10.2119
Link PDF
Genetic Structure of Europeans: A View from the North–East. Nelis et al (2009).
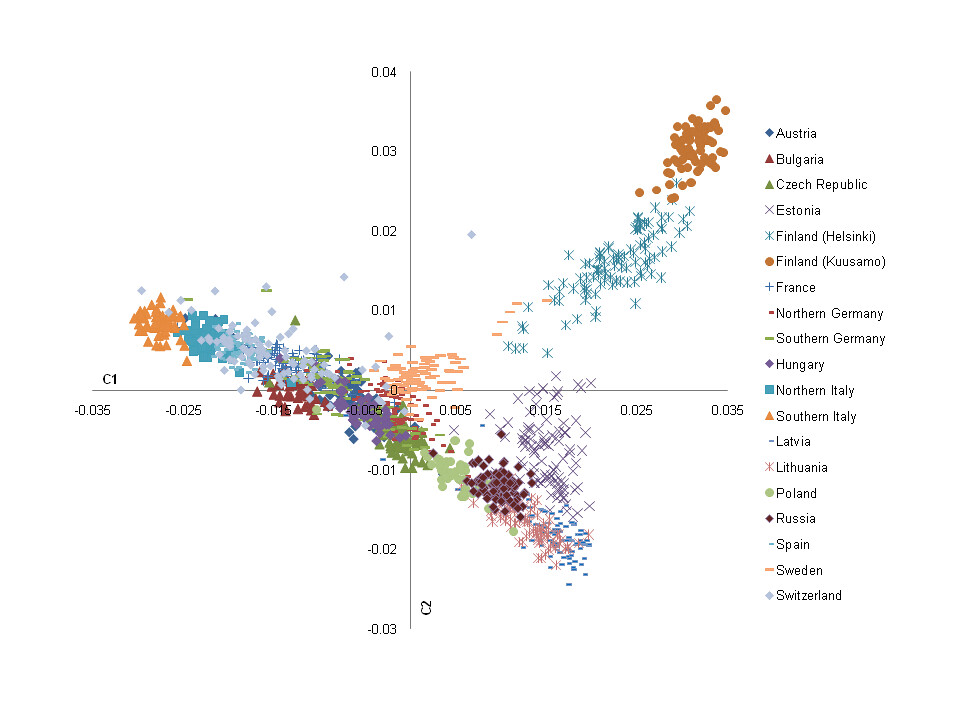
"Using principal component (PC) analysis, we studied the genetic constitution of 3,112 individuals from Europe as portrayed by more than 270,000 single nucleotide polymorphisms (SNPs) genotyped with the Illumina Infinium platform. In cohorts where the sample size was >100, one hundred randomly chosen samples were used for analysis to minimize the sample size effect, resulting in a total of 1,564 samples. This analysis revealed that the genetic structure of the European population correlates closely with geography. The first two PCs highlight the genetic diversity corresponding to the northwest to southeast gradient and position the populations according to their approximate geographic origin. The resulting genetic map forms a triangular structure with a) Finland, b) the Baltic region, Poland and Western Russia, and c) Italy as its vertexes, and with d) Central- and Western Europe in its centre. Inter- and intra- population genetic differences were quantified by the inflation factor lambda (λ) (ranging from 1.00 to 4.21), fixation index (Fst) (ranging from 0.000 to 0.023), and by the number of markers exhibiting significant allele frequency differences in pair-wise population comparisons. The estimated lambda was used to assess the real diminishing impact to association statistics when two distinct populations are merged directly in an analysis. When the PC analysis was confined to the 1,019 Estonian individuals (0.1% of the Estonian population), a fine structure emerged that correlated with the geography of individual counties. With at least two cohorts available from several countries, genetic substructures were investigated in Czech, Finnish, German, Estonian and Italian populations. Together with previously published data, our results allow the creation of a comprehensive European genetic map that will greatly facilitate inter-population genetic studies including genome wide association studies (GWAS)."

Yet again, as we can see by PCA analysis, Northern Italians blend perfectly in the Southern European area, and are the second most "southerly" population sampled here after the Southern Italians. Northern Italians pull further south than Spaniards from Madrid, and while they seem to be a little closer to the Spanish and some Swiss (who are partly Italian) than to Southern Italians, they are equidistant between Southern Italians and the French, and they're much closer to the Southern Italians than to Southern Germans. The Northern Italians also surprisingly pull quite a bit further to the south end of Europe than Bulgarians do, which might mean Bulgarians have substantial medieval Slavic admixture (Bulgarians are southern Slavs after all) which would have brought more "northerly" gene-flow into Bulgaria; there's no telling really regarding them.
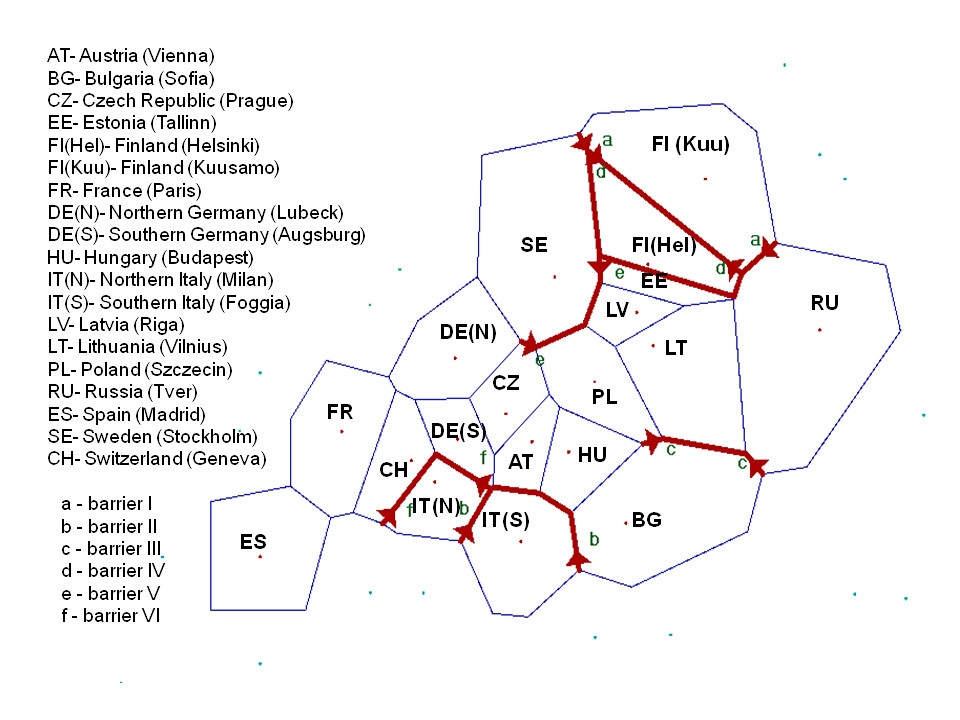
One more thing of note, unlike the other previous two studies, in this study the samples that represented Northern and Southern Italy only came from 2 different locations; here are the sample set locations as representative of "Northern Italy" and "Southern Italy".
As stated above there is a noticeable difference between Northern and Southern Italians, according to PC analysis the medians of North and South Germans seem to be roughly 0.005 apart, while those of North and South Italians seem to be 0.005 apart. So no big difference among the ethnic stratification between the two countries. The biological difference between Northern and Southern Italians though rather noticeable, does seem to have been somewhat exaggerated by laymen 'racialists' of past and present.

One more thing of note, unlike the other previous two studies, in this study the samples that represented Northern and Southern Italy only came from 2 different locations; here are the sample set locations as representative of "Northern Italy" and "Southern Italy".
Northern Italy:
"The Northern Italian samples have been randomly collected from the Borbera Valley. The Borbera Valley is located in Northern Italy, namely the northern part of the Apennines mountains, between Liguria and Piedmont, about 80 km south of Milan. For the current analysis, 96 individuals were selected from the database where all the samples have complete phenotypic data."
Southern Italy:
"The Italian samples were randomly chosen from those enrolled in a population study named Carlantino Project, which is focused on inhabitants arising from an isolated village at the border between Central and Southern Italy (Province of Foggia, Region of Apulia with 1200 inhabitants)."
Also, it is important to note that while genetic distance is often heavily correlated to geographical distance, genetic barriers can be created by substantial geographical barriers which limit gene flow and cause breeding isolation. In Europe the Alps represent such a genetic barrier and it is not surprising that this study confirms that.
"Barrier analysis revealed genetic barriers between Finland, Italy and other countries, as has been described before [12]. Interestingly, barriers could be demonstrated within Finland (between Helsinki and Kuusamo) and Italy (between northern and southern part). Another barrier emerged between the Eastern Baltic region and Sweden, but not between the Eastern Baltic region and Poland (Figure S4). The barrier between Bulgaria and Western Russia, Poland and Lithuania may have arisen due to the fact that several populations are missing in between those countries"

As stated above there is a noticeable difference between Northern and Southern Italians, according to PC analysis the medians of North and South Germans seem to be roughly 0.005 apart, while those of North and South Italians seem to be 0.005 apart. So no big difference among the ethnic stratification between the two countries. The biological difference between Northern and Southern Italians though rather noticeable, does seem to have been somewhat exaggerated by laymen 'racialists' of past and present.
"Interestingly, PC analysis was also capable of highlighting intra-population differences, such as between the two Finnish and the two Italian samples, respectively. A low level of intra-population differentiation in Germany has been reported previously, and was confirmed here. In addition, we detected intra-population differences within the Czech and Estonian samples."

SOURCE : Nelis M, Esko T, Mägi R, Zimprich F, Zimprich A, et al. (2009) Genetic Structure of Europeans: A View from the North–East. PLoS ONE 4(5): e5472. doi:10.1371/journal.pone.0005472
Also, other than the Greeks in Southern Italy, historical admixture seems to be quite minimal in Italians.
"An analysis of the genetic makeup of Italy's modern population argues that the various distinctive genetic combinations currently found in different regions within the peninsula by and large track the linguistic distribution that resulted from the migrations of the Iron Age. No data indicate the subsequent large-scale infusion of new genetic material into the populations of these regions except in the case of southern Italy and eastern Sicily, which is explained by the well-documented Greek migrations there."SOURCE : Rosenstein, Nathan. Rome at War: Farms, Families, and Death in the Middle Republic. Chapel Hill: University of North Carolina Press, 2004.
Link
The genetic article which that book used as a source for that statement is Piazza's "A Genetic History of Italy", and although unfortunately I don't have access to the entire study, the abstract is available online. It's conclusions are clear that the biological stratification seen in today's Italy is reflective of pre Roman times.
"Statistical techniques for displaying the geographical distribution of many genes in few synthetic images have been used to represent the various patterns of gene frequencies in Europe and in the world (Menozzi et al. 1978; Piazza et al. 1981a). It has also been shown that such synthetic displays are particularly useful in detecting clines of genetic differentiation associated with movements of populations like those accompanying the Neolithic expansion of farmers from the Near East or, in more recent times, the putative diffusion of Indo-European-speaking populations (Ammerman & Cavalli-Sforza, 1984; Gimbutas, 1973).SOURCE : Piazza, A., N. Cappello, E. Olivetti, and S. Rendine. 1988. A genetic history of Italy. Ann. Hum. Genet. 52:203-213.
In this paper we use the same combination of statistical and graphical techniques to study the genetic structure of Italy, a European country whose unity of people and cultures was quite a recent event. The possibility of studying genetic differentiation in a small geographical area is tested and trends of genetic differences are tentatively interpreted in terms of historic and linguistic knowledge. The few demographic pieces of information taken from historical sources and compared with linguistic records support the hypothesis that the genetic structure of Italy still reflects the ethnic stratification of pre-Roman times."
Link
(EDIT 2015) Admixture ratios in modern populations based on prehistoric genomes
All populations in Europe can be modeled as being a mixture of 3 major and distinct ancestral strains from prehistoric migrations. These are
1. Paleolithic West European Hunter Gatherers
2. Early European Farmers of the Neolithic revolution who had most their genetic origin in Mesolithic and Neolithic Anatolia and brought the earliest agricultural practices to Europe.
3. Early Bronze age Yamnaya steppe pastoralists from the Pontic-Caspian steppe, who's ancestors were the first to domesticate the horse. They were also one of the first groups on Earth who knew of and used wheeled vehicles. The Yamnaya steppe pastoralists are believed by most linguists to have been the speakers of the late stage proto Indo-European language (see Kurgan hypothesis).
As we can see in Figure 3 below, all Europeans can basically be modeled as a composite of the same 3 ancestral mixtures, it's just that the ratios are different. We can also see that that the biggest differences in Europe are between the North of Europe, and the South of Europe. As we can see in their admixture ratios, the Northern Italians (here represented by a sample set from Bergamo Lombardy) are unsurprisingly most similar to other Southern Europeans (ie Northern Spanish, Greeks, Albanians, Bulgarians, etc) in their admixture ratios, and that is being of heavy Early Neolithic Farmer ancestry. Tuscans as anyone can see also come out very heavily Neolithic.

SOURCE : Haak, et al. (2015). "Massive migration from the steppe was a source for Indo-European languages in Europe". Nature. doi:10.1038/nature14317.edit
Link
And lastly, for the most part irrelevant, I found some old hair and eye pigmentation data from Livi on Italian conscripts. Interesting stuff but for the most it's not that important.
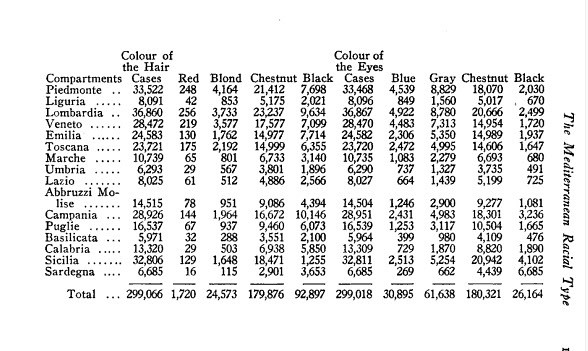

SOURCE : Antropometria Militare. Ridolfo Livi. Two volumes, 4°, with atlas. Rome: Preso il Giornale Medico del Regio E Sercito, 1896, 1905..
Summary and conclusions
1. Northern and Central Italians are biologically SOUTHERN European...broadly speaking. In so far that they share their overall closest genetic relationships with other Southern Europeans, and that they are more distinct from Northern European groups than the Spanish.
2. Northern-Central Italians may be a bit closer to North/Central/East Europeans than Southern Italians are (just as Southern Germans are a bit closer to Southern Europeans than Northern Germans are), but Northern-Central Italians still biologically pull to Southern Europe quite strongly as seen that they ALWAYS pull further south than Spaniards, and also one study showed them a bit below Balkan Southern Slavs like Bulgarians. They also always structure with Southern Europeans in European exclusive STRUCTURE analysis studies. And their admixture ratios based on actual ancient genomes using formal admixture modeling is much more similar to the ratios present in other Southern Europeans than in Northern Europeans.
3. Slight Germanic admixture is possible for all Italian populations, not just the Northern Italians. I would venture that actual Germanic ancestry is larger in Northern Italy and that the Lombards in Northern Italy had a bigger impact than the Goths or Normans in Southern Italy. However one thing is for certain, and that is that large scale Germanic admixture in any Italian groups is certainly not the case and easily refuted by the data. Anything beyond that is total conjecture at this point.
4. There is a noticeable difference between the Northern Italians and Southern Italians, and I don't want people to think that Northern Italians cannot be argued to be a genetically distinct. Also, the genetic distance between Northern and Southern Italians, although pretty large from a single European 'nationality' point of view, is only roughly equal [marginally greater] to that of the genetic distance between Northern Germans and Southern Germans.