Above : Notorious 2oth century Jewish physicists Albert Einstein and Robert Oppenheimer converse.
Love them or hate them, no ethnic group has shown more intellectual achievement the last 2 and half centuries than the Jews. Dwarfing the competition, The Jews compromising only 0.2% of the world's population have accumulated 41% of all the Nobel prizes in economics, 28% of medicine, 26% of Physics, 19% of Chemistry, 13% in Literature, and even 9% in the less impressive "peace" prize.
Regardless of achievement, there still persists a few racial and anti Semitic myths regarding their ethnic origins. It is often erroneously believed that Ashkenazi Jews are a heterogeneous cultural group and not a distinct ethnic group. Or that Jews, including the Ashkenazi, are recent converts who are genetically/ancestrally related to their Christian host populations they lived among in North/Central/Eastern Europe, or were ethnic Khazar converts to the Judaic religion. However, these notions have been completely falsified by modern genetic science. All genome wide genetic data shows that the Ashkenazi are an ethnic group with the predominant amount of their ancestry going back to the ancient Eastern Mediterranean region. The genetic data proves they are related to their fellow European and Levantine ethnic Jewish groups first and foremost, and secondly to Southeastern Europeans. All the while the data shows them clustering further away from their host populations in Northern, Central, and Eastern Europe than Southeastern Europeans, and also showing negligible Khazar/Turkic admixture. There exists a number of genome wide studies demonstrating these facts.
European Population Substructure: Clustering of Northern and Southern Populations. Seldin et al (2006).
Abstract
"Using
a genome-wide single nucleotide polymorphism (SNP) panel, we observed
population structure in a diverse group of Europeans and European
Americans. Under a variety
of conditions and tests, there is a consistent and reproducible
distinction between “northern” and “southern” European population
groups: most individual participants with southern European ancestry
(Italian, Spanish, Portuguese, and Greek) have >85% membership in the
“southern” population; and most northern, western, eastern, and central
Europeans have >90% in the “northern” population group. Ashkenazi
Jewish as well as Sephardic Jewish origin also showed >85%
membership in the “southern” population, consistent with a later
Mediterranean origin of these ethnic groups. Based on this work, we have
developed a core set of informative SNP markers that can control for
this partition in European population structure in a variety of clinical
and genetic studies."
Synopsis
"Two
unrelated persons in the human population have hundreds of thousands of
base pair differences between them in DNA sequence. Previous studies
have shown that a small proportion of these sequence differences
correlate with a person's continental ancestry: broadly, Asia, Africa
Oceana, America, or continental Europe. In the current study, DNA
differences within a particular continental group, Europe, were
examined. Overall, the analysis of sequence variation allowed the
authors to distinguish individuals with northern European ancestry
(Swedish, English, Irish, German, and Ukrainian) from individuals with
southern European ancestry (Italian, Spanish, Portuguese, and Greek).
Interestingly, Ashkenazi Jewish individuals tend to group together with
individuals from southern European countries. This study is important
because it provides a method of taking into account these differences
when searching for genetic variations that are associated with
particular human traits, such as disease susceptibility, response to
drug treatment, or side effects from therapy. Specifically, these
methods may allow scientists to uncover disease-associated genetic
variations that might be hidden unless differences related to European
ancestry are considered "

Note above FIGURE 3 : The Ashkenazi are clustering overwhelmingly in the "Southern" population group along with Southern Europeans. A striking demonstration shown in (C) when 4 of 4 grandparents are verified. The Ashkenazi all range from red (90%+ 'southern') to orange (60-90% 'southern'), while none belong to any blue, green, or yellow cluster in complete contrast to their host populations in North/Central/Eastern Europe.
In this pan European + European Jewish context, there's not a huge difference between Sephardi and
Ashkenazim Jews, and both are similar to Italians and Greeks.
FIGURE 4 below illustrates the same thing.
SOURCE : Seldin MF, Shigeta R, Villoslada
P, Selmi C, Tuomilehto J, et al. (2006) European Population
Substructure: Clustering of Northern and Southern Populations. PLoS
Genet 2(9): e143. doi:10.1371/journal.pgen.0020143
Link PDF
The data doesn't stop there though, while Seldin et al. (2006) used between 5,000 and 749 SNPs in their various analysis using STRUCTURE, a year later Bauchet et al. (2007) corroborated these earlier results using 10,000 SNPs.
Measuring European Population Stratification with Microarray Genotype Data. Bauchet et al (2007).
Abstract
"A
proper understanding of population genetic stratification—differences
in individual ancestry within a population—is crucial in attempts to
find genes for complex traits through association mapping. We report on
genomewide typing of ∼10,000 single-nucleotide polymorphisms in 297
individuals, to explore population structure in Europeans of known and
unknown ancestry. The results reveal the presence of several significant
axes of stratification, most prominently in a northern-southeastern
trend, but also along an east-west axis. We also demonstrate the
selection and application of EuroAIMs (European ancestry informative
markers) for ancestry estimation and correction. The Coriell Caucasian
and CEPH (Centre d'Étude du Polymorphisme Humain) Utah sample panels,
often used as proxies for European populations, are found to reflect
different subsets of the continent’s ancestry."
"To address this issue further, we typed 297 individuals from 21 European
and world populations for ∼10,000 autosomal SNPs, primarily using
Affymetrix 10K mapping arrays. The European population samples represent
a broad range of the geographic and linguistic diversity of the
continent. In brief, they consisted of western Irish (n=6), eastern English (n=8), French (n=1), German (n=8), Valencian Spanish (n=20), Basque Spanish (n=8), Italian (n=9), Polish (n=8), Greek (n=8), Finnish (n=7), Armenian (n=8), and Ashkenazi Jewish (n=5)
subjects. The Italian, Ashkenazi Jewish, and Greek samples include 2,
1, and 1 individuals, respectively, from the Coriell Cell Repository."
As stated by the authors above, the largest genetic split in Europe occurs between the North and Southeast, no doubt as a primary result of the Eurasian Neolithic's heavy genetic impact on the Southeast.
"PC1 largely separates northern from southeastern individuals and is consistent with the clines observed in classic gene-frequency, Y-chromosome, mtDNA,and whole-genome studies of European diversity. PC2 reflects mainly east-west geographic
separation and, particularly, identifies the two Iberian populations
(Spanish and Basques) in our analysis as distinct. Furthermore, PC3 and PC4 emphasize the separation of the Basques and Finns, respectively, from other Europeans. The Basques are known to have unusual allele frequencies for several marker systems
and speak a unique non–Indo-European language. In line with their
non–Indo-European Uralic language and previous study of their
Y-chromosomes,
the Finns show evidence of an increased affinity to the Central Asian
populations when placed in an intercontinental context (fig.1A1A and 1B) ).

As we can also observe above in Figure 4A in the PCA, The Jewish sample which is Ashkenazi clusters deep into the Southeastern group roughly in between Greeks and Armenians. And as the authors state below, the STRUCTURE analysis results shown in Figure 4B below yield the same thing.
"Overall, STRUCTURE analysis of the European populations is highly
consistent with PCoA; for example, when the number of populations (K) is 3, the major divisions correspond to the northern, southeastern, and Iberian populations (fig. 4B). In cases of higher K values, first the Finns (K=4) and then the Basques (K=5) emerge as distinctive."
Continuing on as if the data in figure 4B wasn't clear enough, the authors state the
Ashkenazi Jewish sample is shown shown to cluster with Greeks and Armenians,
and not with Northern and Eastern Europeans like Germans, Poles, Irish, or English.
"Within the two broad northern (Polish, Irish, English, Germans, and some
Italians) and southeastern (Greeks, Armenians, Jews, and some Italians)
clusters, further reliable structure is less obvious because
individuals from different population samples are often interspersed
with each other. Thus, in some cases, geographic distance or physical
barriers are not well reflected. For instance, despite their insular
origin, Irish and English individuals cluster with the continental
Germans and Poles. Similarly, large geographical gaps, such as that
between Greece and Armenia, are much less obvious at the genetic level.
Conversely, Italy appears to be a zone of sharp differentiation over
small distances. Some Italians cluster with the northern Europeans,
whereas others fall into the southeastern grouping (fig. 4A).
The SKT confirms significant stratification within those metaclusters,
as suggested by the wide amount of PCoA space occupied by each (fig. 4A).
Significant SKT stratification is also observed within the Spanish and
the Italian samples. However, Mantel correlations between genetic and
geographic distance were not significant within northern and
southeastern metaclusters. It is likely that additional populations,
additional individuals for some populations, and an increased number of
markers will be required to investigate the nature and extent of these
more subtle patterns."
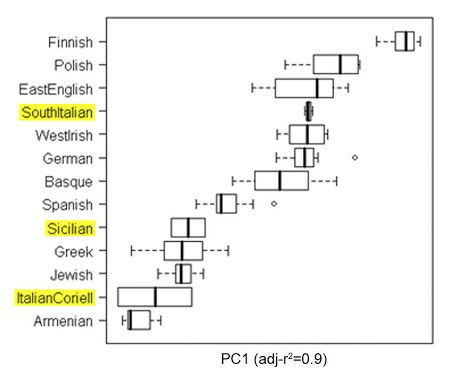
The only thing particularly bizarre here is that you may notice that 3 Italian outliers are clustering with Northern Europe. A lot of people without looking at the actual data [since the authors don't clarify] initially assumed they were Northern Italians, however it's actually 3 Southern Italian anomalies clustering in the northern cluster [clearly some sort extremely rare near pure remnants of Gothic/Vandal or Norman invasions] and the Sicilians and North-Central Italians from Tuscany labelled Italian-Coriell cluster where you'd expect, in the southeastern cluster.
But more importantly and back to the point for this blog entry, this study again irrefutably proves the East Mediterranean affinity of the Ashkenazi Jews and their lack of any sort of strong ancestral ties with their former host populations.
SOURCE : Bauchet, M. et al. (2007) Measuring European Population Stratification using Microarray Genotype Data. American Journal of Human Genetics
Link PDF
With these 2 studies alone it was pretty clear, however even more markers were needed to give even more precise details about the specifics where the Ashkenazism genetically reside. And a few years later geneticists released several massive new studies on Eurasians and Jews based on hundreds of thousands of autosomal SNPs.
Refinement of ancestry informative markers in Europeans. Tian et al (2009).
"The
definition of European population genetic substructure and its
application to understanding complex phenotypes is becoming increasingly
important. In the current study using over 4,000 subjects genotyped for
300,000 single-nucleotide polymorphisms (SNPs), we provide further
insight into relationships among European population groups and identify
sets of SNP ancestry informative markers (AIMs) for application in
genetic studies. In general, the graphical description of these
principal components analyses (PCA) of diverse European subjects showed a
strong correspondence to the geographical relationships of specific
countries or regions of origin. Clearer separation of different ethnic
and regional populations was observed when northern and southern
European groups were considered separately and the PCA results were
influenced by the inclusion or exclusion of different self-identified
population groups including Ashkenazi Jewish, Sardinian, and Orcadian
ethnic groups. SNP AIM sets were identified that could distinguish the
regional and ethnic population groups. Moreover, the studies
demonstrated that most allele frequency differences between different
European groups could be controlled effectively in analyses using these
AIM sets. The European substructure AIMs should be widely applicable to
ongoing studies to confirm and delineate specific disease susceptibility
candidate regions without the necessity of performing additional
genome-wide SNP studies in additional subject sets."
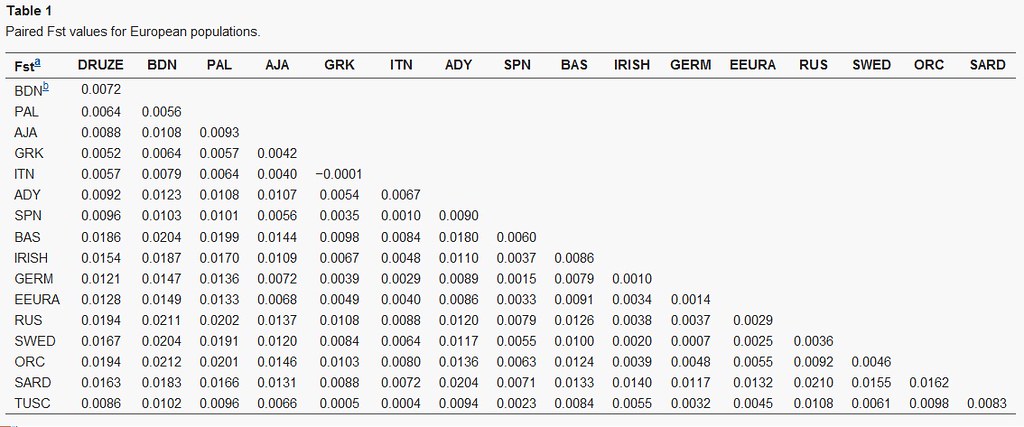
This particular study was of great value since it was not only based on a number of markers unseen before, it came with an excellent and useful Fst genetic distance table where the authors numerically valued the genetic relationships between Eurasian groups. The Ashkenazi Jews were included as seen in Table 1 labeled below as AJA [Ashkenazi Jewish Americans].
To Southeastern Europeans
Ashkenazi Jews to "Italian Americans" (Southern Italians) - 0.0040
Ashkenazi Jews to Greeks - 0.0042
To Levantines
Ashkenazi Jews to Druze - 0.0088
Ashkenazi Jews to Palestianians - 0.0093
* Unfortunetely for our Levantine samples all that were included in this study were Islamic groups which have received significant gene-flow from the Arabian Peninsula and even Sub-Saharan Africa. It would be nice to compare the Ashkenazi to other Jews like the Sephardi, and Levantine Christian groups as well.
To Central/North/Eastern Europeans
Ashkenazi Jews to Germans - 0.0072
Ashkenazi Jews to Irish - 0.0109
Ashkenazi Jews to Swedish - 0.0120
Ashkenazi Jews to Russians - 0.0137
Askkenazi Jews to Orcardians - 0.0146
And as we can see, Southeastern Europeans like Greeks are closer and more ancestrally related to North/Central/Eastern Europeans than Ashkenazi Jews are to North/Central/Eastern Europeans.
Greeks to Germans - 0.0039
Greeks to Irish - 0.0067
Greeks to Swedish - 0.0084
Greeks to Russians - 0.0108
Greeks to Orcadians - 0.0103
So what can we honestly say with this knowledge? Well for 1 it appears when even greater amount of markers are used like in this study unlike the first 2 in this blog entry, the Ashkenazi show distinction from Southeastern Europeans. My guess is they cluster somewhere between Levantine Christian groups (who have not been effected by the geneflow the Islamic groups have) and Southeastern Europeans, and like other studies show they are most similar to their Sephardi Jewish cousins.
SOURCE : Tian
et al. (2009). European Population Genetic Substructure: Further
Definition of Ancestry Informative Markers for Distinguishing Among
Diverse European Ethnic Groups. Mol Med; doi: 10.2119
Link PDF
Another genome wide study again showed Ashkenazi Jews clustering with Southern Europeans rather than their former host populations north of the Alps. Fortunately this study also includes other Jewish for compare and contrast, and non European Middle Eastern populations as well.
Abraham's Children in the Genome Era: Major Jewish Diaspora
Populations Comprise Distinct Genetic Clusters with Shared Middle
Eastern Ancestry. Gil Atzmon et al (2010).
"For more than a century, Jews and non-Jews alike have tried to define
the relatedness of contemporary Jewish people. Previous genetic studies
of blood group and serum markers suggested that Jewish groups had Middle
Eastern origin with greater genetic similarity between paired Jewish
populations. However, these and successor studies of monoallelic Y
chromosomal and mitochondrial genetic markers did not resolve the issues
of within and between-group Jewish genetic identity. Here, genome-wide
analysis of seven Jewish groups (Iranian, Iraqi, Syrian, Italian,
Turkish, Greek, and Ashkenazi) and comparison with non-Jewish groups
demonstrated distinctive Jewish population clusters, each with shared
Middle Eastern ancestry, proximity to contemporary Middle Eastern
populations, and variable degrees of European and North African
admixture. Two major groups were identified by principal component,
phylogenetic, and identity by descent (IBD) analysis: Middle Eastern
Jews and European/Syrian Jews. The IBD segment sharing and the
proximity of European Jews to each other and to southern European
populations suggested similar origins for European Jewry and refuted
large-scale genetic contributions of Central and Eastern European and
Slavic populations to the formation of Ashkenazi Jewry. Rapid decay
of IBD in Ashkenazi Jewish genomes was consistent with a severe
bottleneck followed by large expansion, such as occurred with the
so-called demographic miracle of population expansion from 50,000 people
at the beginning of the 15th century to 5,000,000 people at the
beginning of the 19th century. Thus, this study demonstrates that
European/Syrian and Middle Eastern Jews represent a series of
geographical isolates or clusters woven together by shared IBD genetic
threads."

Notice in the PCA above panel B from Figure 1 which shows the first
two principal components in a regional context. The labels in bold red
represent Jewish groups, while labels in light grey represent gentile groups. Notice the Ashkenazi Jews pull further away from more northerly populations like the French or Russians and pull further away in an Eastern direction than Northern Italians. Unfortunately for gentile groups Southern Italians and Greeks weren't sampled for a compare and contrast in this PCA analysis, but if they were they'd be in between Ashkenazi Jews and Northern Italians.
The authors also go on to suggest that although the Ashkenazi did pick up some noticeable gentile admixture on their way to Central Europe, the bulk of this ancestry must have been from around the Mediterranean region in Europe.
"Two major differences among the populations in this study were the high
degree of European admixture (30%–60%) among the Ashkenazi, Sephardic,
Italian, and Syrian Jews and the genetic proximity of these populations
to each other compared to their proximity to Iranian and Iraqi Jews.
This time of a split between Middle Eastern Iraqi and Iranian Jews and
European/Syrian Jews, calculated by simulation and comparison of length
distributions of IBD segments, is 100–150 generations, compatible with a
historical divide that is reported to have occurred more than 2500
years ago.The Middle Eastern populations were formed by Jews in the Babylonian
and Persian empires who are thought to have remained geographically
continuous in those locales. In contrast, the other Jewish populations
were formed more recently from Jews who migrated or were expelled from
Palestine and from individuals who were converted to Judaism during
Hellenic-Hasmonean times, when proselytism was a common Jewish practice.
During Greco-Roman times, recorded mass conversions led to 6 million
people practicing Judaism in Roman times or up to 10% of the population
of the Roman Empire. Thus, the genetic proximity of these
European/Syrian Jewish populations, including Ashkenazi Jews, to each
other and to French, Northern Italian, and Sardinian populations favors
the idea of non-Semitic Mediterranean ancestry in the formation of the
European/Syrian Jewish groups and is incompatible with theories that
Ashkenazi Jews are for the most part the direct lineal descendants of
converted Khazars or Slavs. The genetic proximity of Ashkenazi Jews to southern European populations has been observed in several other recent studies."
And lastly a compare and contrast only between Jewish groups and European groups. The Jewish groups represented by the circular symbols labeled in bold red while the Europeans are square. Follow the key to for specifics on the Europeans. Some European groups have been pooled together.
Key: S -
Italy, Swiss-Italian; SE - Albania, Bosnia-Herzegovina, Bulgaria,
Croatia, Greece, Kosovo, Macedonia, Romania, Serbia, Slovenia, former
Yugoslavia; SW - Portugal, Spain; E - Czech Republic, Hungary; ESE -
Cyprus, Turkey; C - Austria, Germany, Netherlands, Swiss-German; W -
Belgium, France, Swiss-French; N - Denmark, Norway, Sweden; NE - Poland (+ 6 Russians from Moscow, one Finn, one Latvian and one Ukrainian); NW - Ireland, Scotland, UK.
Following the PCA plot above we see the Syrian, Greek + Turkish, Italian, and Ashkenazi Jews form a major cluster. Basically a Syrian-Sephardi-Ashkenazi Jewish mega cluster distinct from Oriental Jews. Though the Ashkenazi represented by the bright red dots seem to be ever so slightly more northern influenced than the Sephari Jewish groups, they still plot below the majority of Southern Europe. The Italians represented by the hot pink squares show significant diversity and pull furthest south of all Europeans. More than likely the ones closest to Ashkenazi are Southern Italians and Sicilians and the Italian higher North are Northern Italians. The Italian samples are from all over Italy and even includes Swiss-Italians. Greeks meanwhile are pooled in with other Balkan groups and are represented by the dark blue square symbols. The Northern European groups remain in hyperboria compared the Ashkenazi Jews.
SOURCE : Gil Atzmon et al. Abraham's Children in the Genome Era:
Major Jewish Diaspora Populations Comprise Distinct Genetic Clusters
with Shared Middle Eastern Ancestry AJHG doi:10.1016/j.ajhg.2010.04.015
Link


